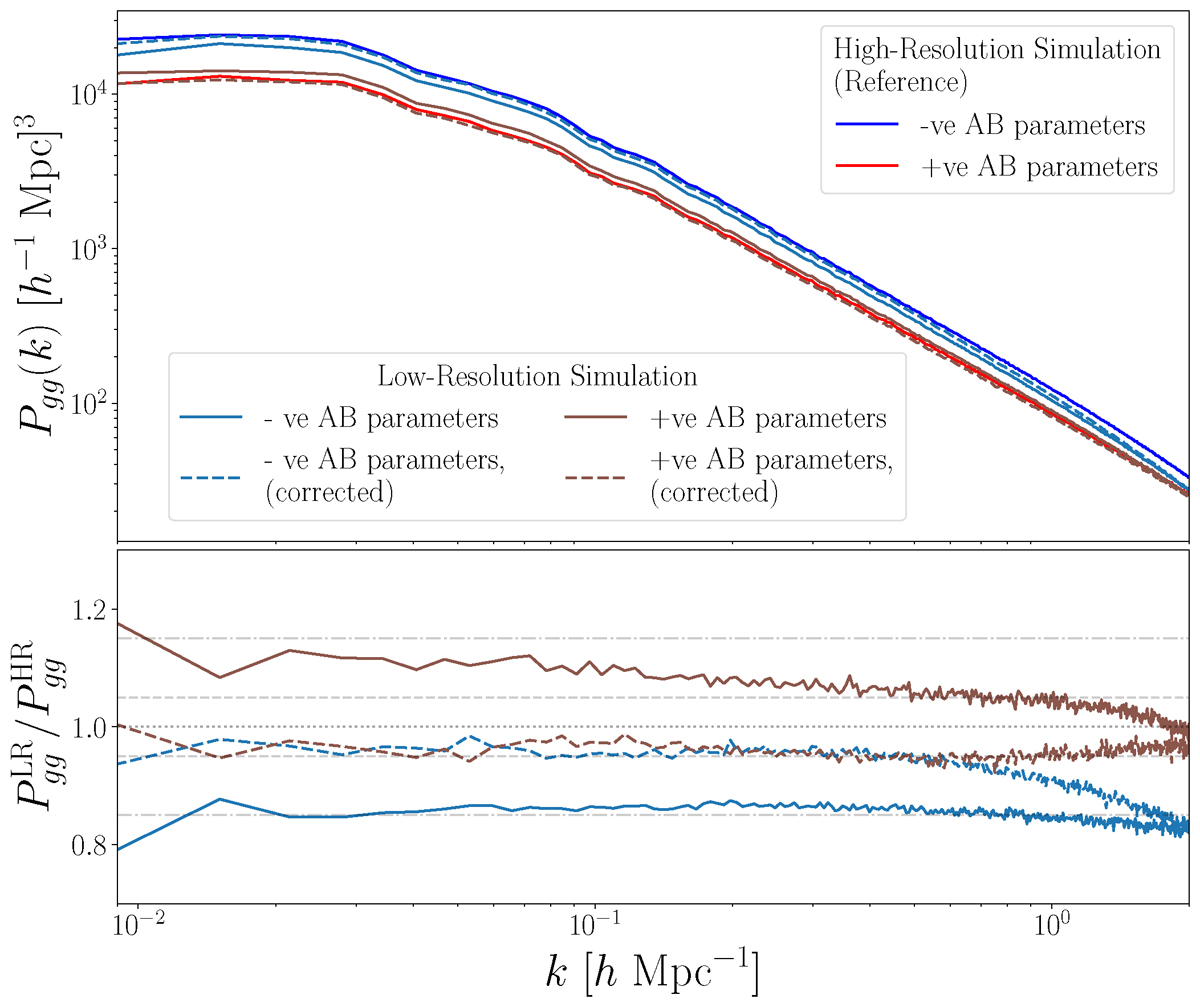
Fig. 6.
Download original image
Top panel: Power spectrum for model central galaxies. In red are shown the power spectra measured in catalogues produced with a positive AB (+ve AB), with Acen=Bcen=Ccen=Dcen = 1 in Eq. (13); in blue, those from catalogues with a negative AB (–ve AB), with Acen=Bcen=Ccen=Dcen=−1. Continuous brighter lines show the results for galaxies generated on the HR simulation, while continuous lines with darker colours correspond to the LR simulation, as indicated in the legend. The dashed lines show the clustering from those catalogues generated on LR haloes corrected with HALOSCOPE, LR+HALOSCOPE. There are differences between the power spectrum measured from galaxies within the +ve AB and –ve AB catalogues, due to galaxy AB. These differences range from 20 to 50% and are present in the whole range of k modes. Bottom panel: Ratios with respect to the galaxy catalogues from the HR simulation of both the LR (solid lines) and LH+HALOSCOPE (dashed lines) dark matter haloes. The 0, 5, and 15 percent levels are indicated by horizontal grey lines. The ratios of power spectra from two tracers in the same density field cancel the statistical noise in the bottom panel, the fixed-pair method used in the UNIT simulations (more details in Sect. 6.2) also mitigates noise from cosmic variance. There are 15% differences between the power spectrum of HR and LR galaxy catalogues. Our algorithm, can reduce this difference to 5%.
Current usage metrics show cumulative count of Article Views (full-text article views including HTML views, PDF and ePub downloads, according to the available data) and Abstracts Views on Vision4Press platform.
Data correspond to usage on the plateform after 2015. The current usage metrics is available 48-96 hours after online publication and is updated daily on week days.
Initial download of the metrics may take a while.