Fig. 3.
Download original image
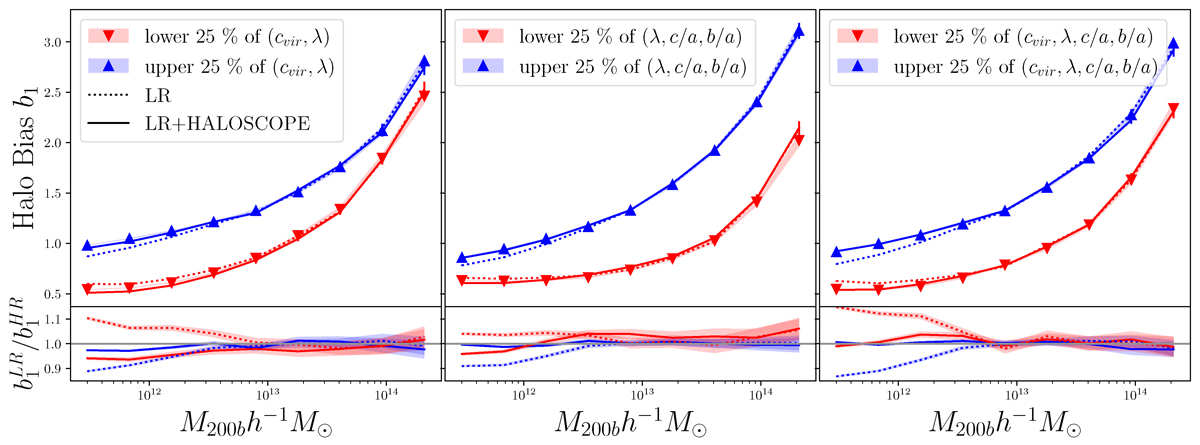
Top panels: Linear halo bias as a function of halo mass for split populations of haloes, to show the halo AB. In blue (red) is shown the linear bias of the upper (lower) 25% of haloes according to: concentration and spin in the left panel; spin and two shape parameters in the middle panel; and concentration, spin, and two shape parameters in the right panel (see Sect. 5 for a detailed description of how the different halo populations are defined). Triangles show the HR haloes, dotted lines the LR ones, and the thick continuous lines are the result of applying HALOSCOPE to the LR haloes, LR+HALOSCOPE. Shaded regions correspond to the standard error of the mean. Bottom panels: LR and LR+HALOSCOPE results divided by the HR ones. This shows that our method when applied to the LR haloes can decrease the differences between HR and LR from ∼12−15% to less than 5%. Our algorithm is capable of recovering the multi-dimensional halo AB measured in HR simulations.
Current usage metrics show cumulative count of Article Views (full-text article views including HTML views, PDF and ePub downloads, according to the available data) and Abstracts Views on Vision4Press platform.
Data correspond to usage on the plateform after 2015. The current usage metrics is available 48-96 hours after online publication and is updated daily on week days.
Initial download of the metrics may take a while.