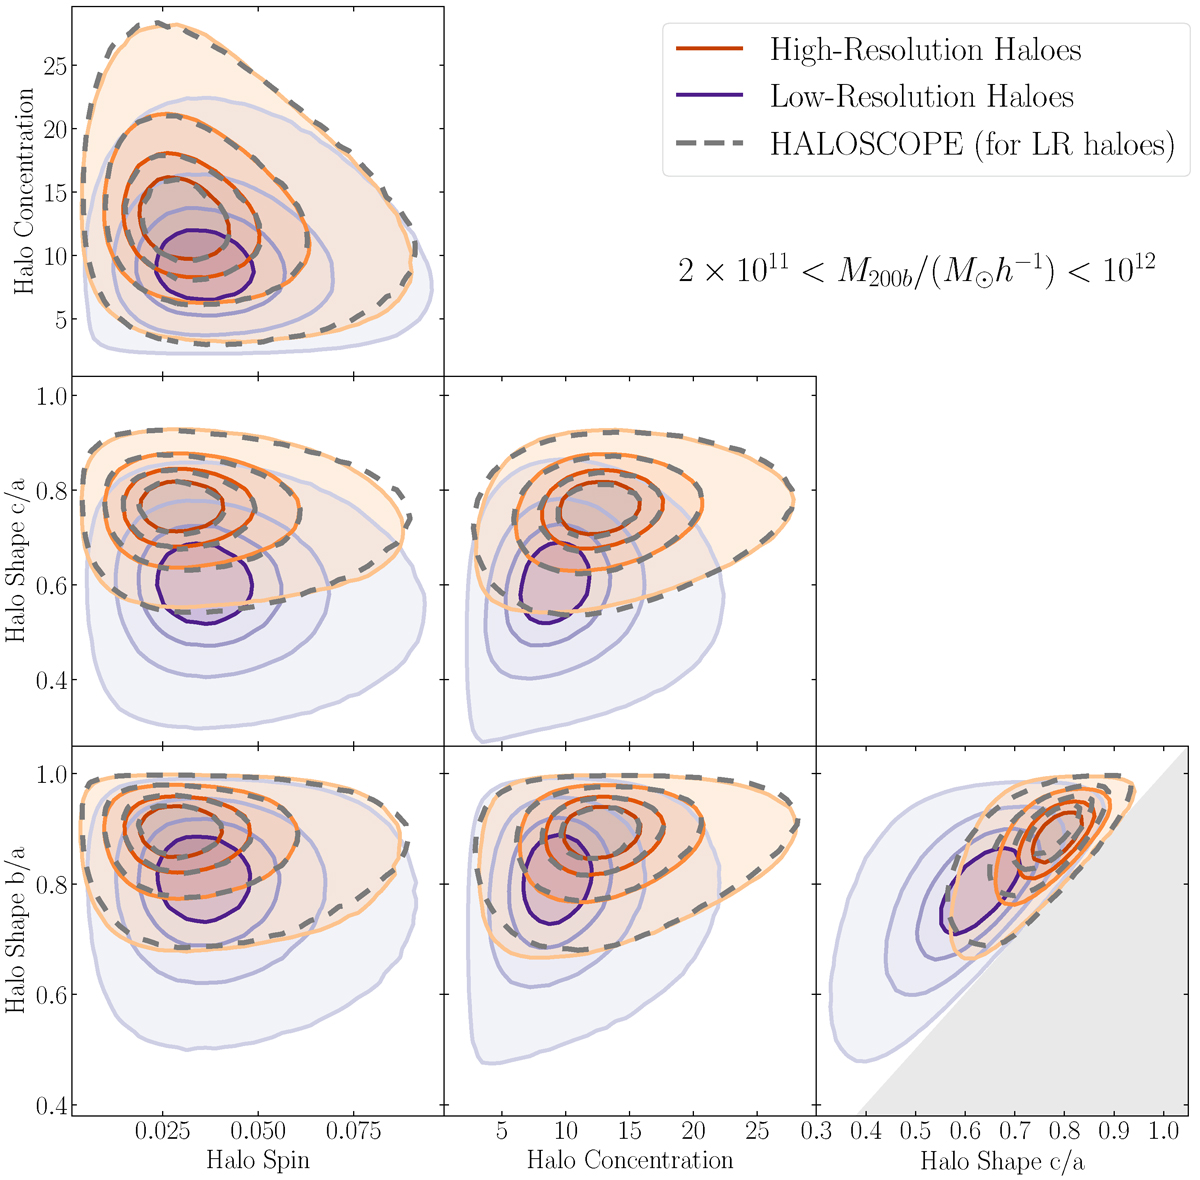
Fig. 2.
Download original image
Confidence intervals (20%, 40%, 68%, and 95%) for the bi-variate distribution of pairs of halo properties in the mass range 2×10¹¹<M200b (M⊙ h−1)<1012, corresponding to haloes having from 20 to 100 particles in the LR simulation. Purple contours show the distribution of LR haloes and orange the HR haloes. The dashed black contours represent the new distribution of the LR haloes after applying HALOSCOPE. In the bottom right panel the grey area simply indicates a forbidden region due to the constraint a>b>c. Since our algorithm is designed to reproduce any multi-dimensional skewed distributions, it can also recover the bivariate distribution of LR halo properties as shown here.
Current usage metrics show cumulative count of Article Views (full-text article views including HTML views, PDF and ePub downloads, according to the available data) and Abstracts Views on Vision4Press platform.
Data correspond to usage on the plateform after 2015. The current usage metrics is available 48-96 hours after online publication and is updated daily on week days.
Initial download of the metrics may take a while.