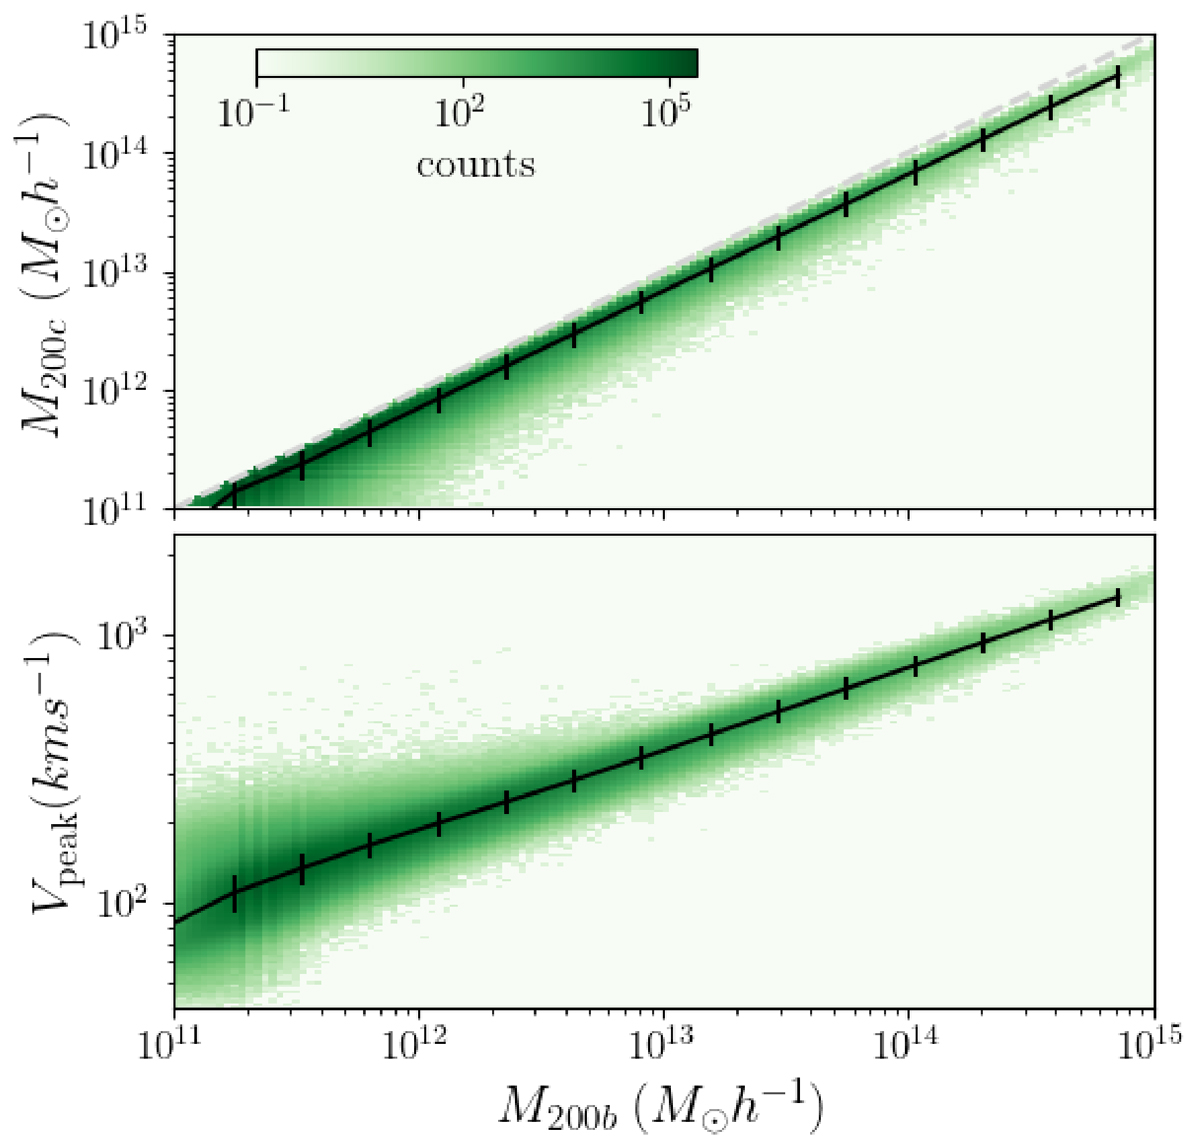
Fig. C.1.
Download original image
Correlation between M200b and M200c (top panel) and Vpeak (bottom panel). Black lines show the median and standard deviation. The number of haloes are shown as coloured regions, following the colour bar. The dashed grey line shows the one-to-one relation. All definitions of the halo mass are highly correlated, although there is substantial scatter in the case of Vpeak.
Current usage metrics show cumulative count of Article Views (full-text article views including HTML views, PDF and ePub downloads, according to the available data) and Abstracts Views on Vision4Press platform.
Data correspond to usage on the plateform after 2015. The current usage metrics is available 48-96 hours after online publication and is updated daily on week days.
Initial download of the metrics may take a while.