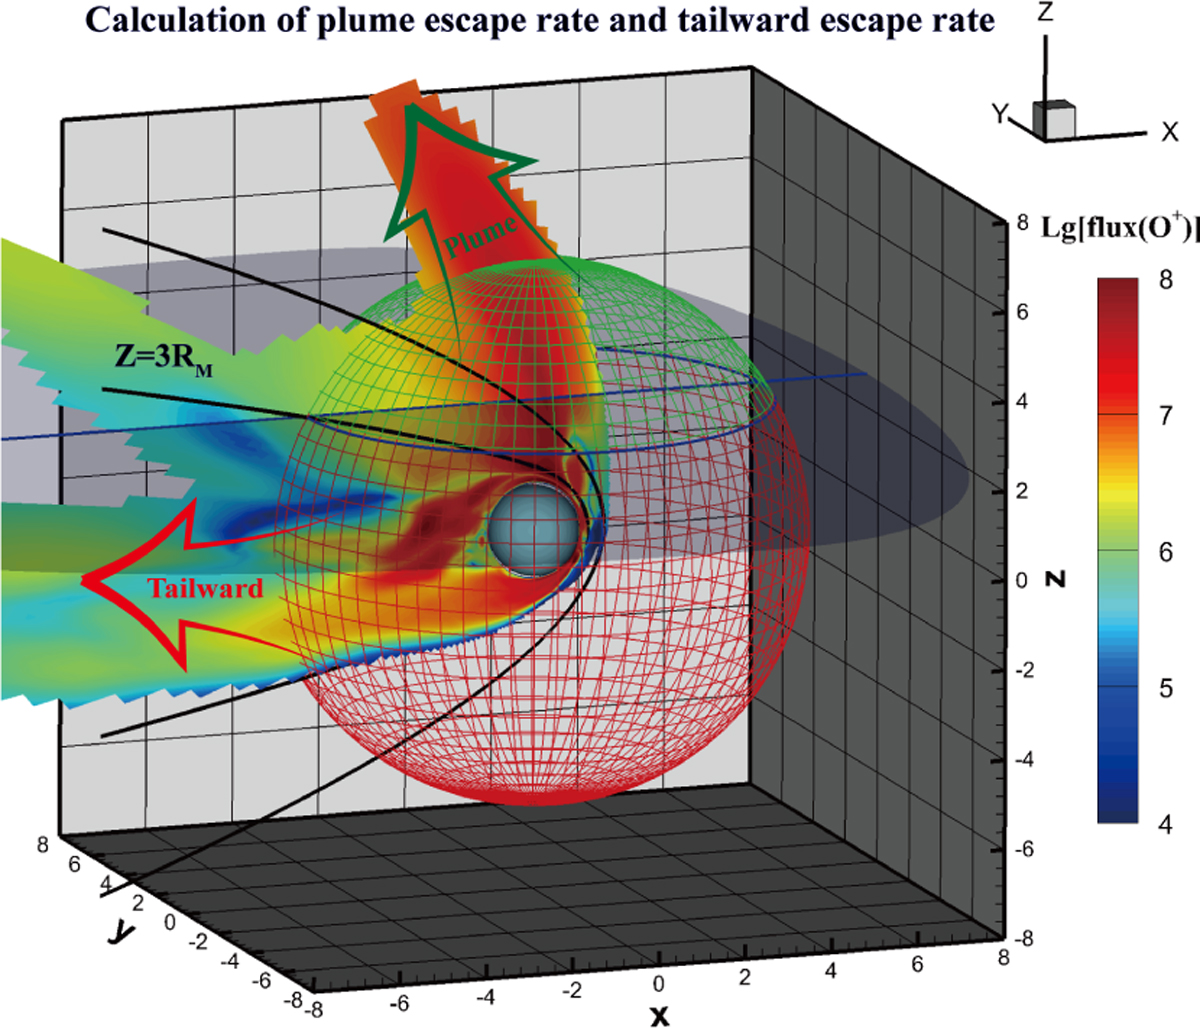
Fig. 5
Download original image
Method for determining escape rates in the plume and the tail. The color plot represents common logarithms of radial escape fluxes of O+ ion. The solid black lines represent the MPB and BS (e.g., Vignes et al. 2000), while the black dotted line depicts a circle with radius of 6RM. The tailward escape is indicated by a red line and arrow, while the plume escape is denoted by a green line and arrow.
Current usage metrics show cumulative count of Article Views (full-text article views including HTML views, PDF and ePub downloads, according to the available data) and Abstracts Views on Vision4Press platform.
Data correspond to usage on the plateform after 2015. The current usage metrics is available 48-96 hours after online publication and is updated daily on week days.
Initial download of the metrics may take a while.