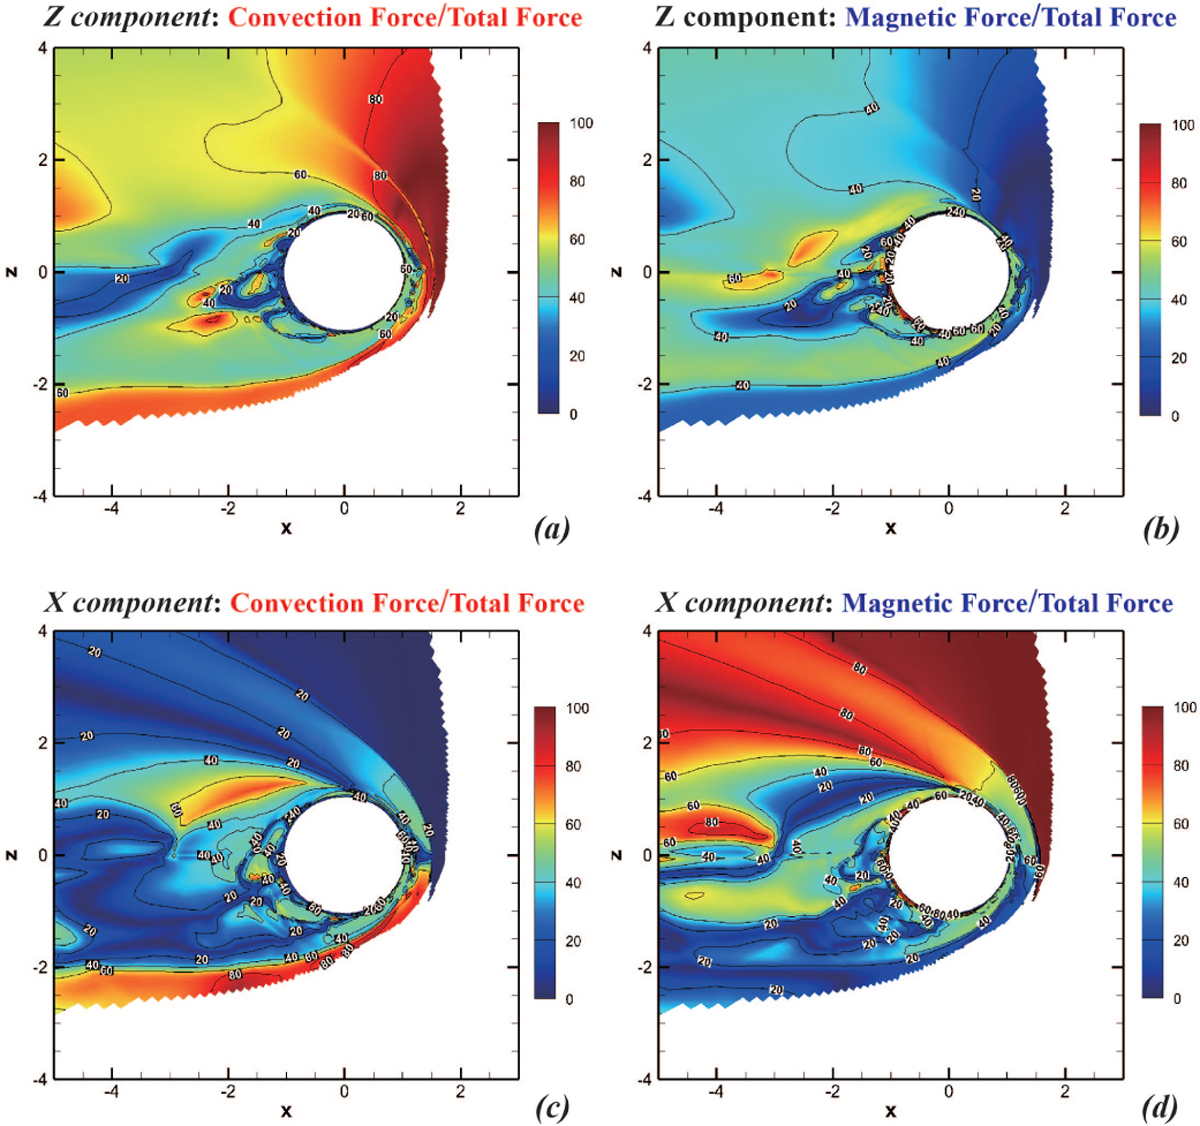
Fig. 4
Download original image
Relative contributions of the EM field components in the X − Z plane. This figure quantifies the percentage of the convection electric field (panels a and c) and the magnetic force field (panels b and d) relative to the total field in the Z direction (panels a and b) and the X direction (panels c and d). The areas where the O+ ion density is below 0.001cm−3 have been blanked out. The black contour lines provide a visual representation of the field intensities across the plane.
Current usage metrics show cumulative count of Article Views (full-text article views including HTML views, PDF and ePub downloads, according to the available data) and Abstracts Views on Vision4Press platform.
Data correspond to usage on the plateform after 2015. The current usage metrics is available 48-96 hours after online publication and is updated daily on week days.
Initial download of the metrics may take a while.