Fig. 1

Download original image
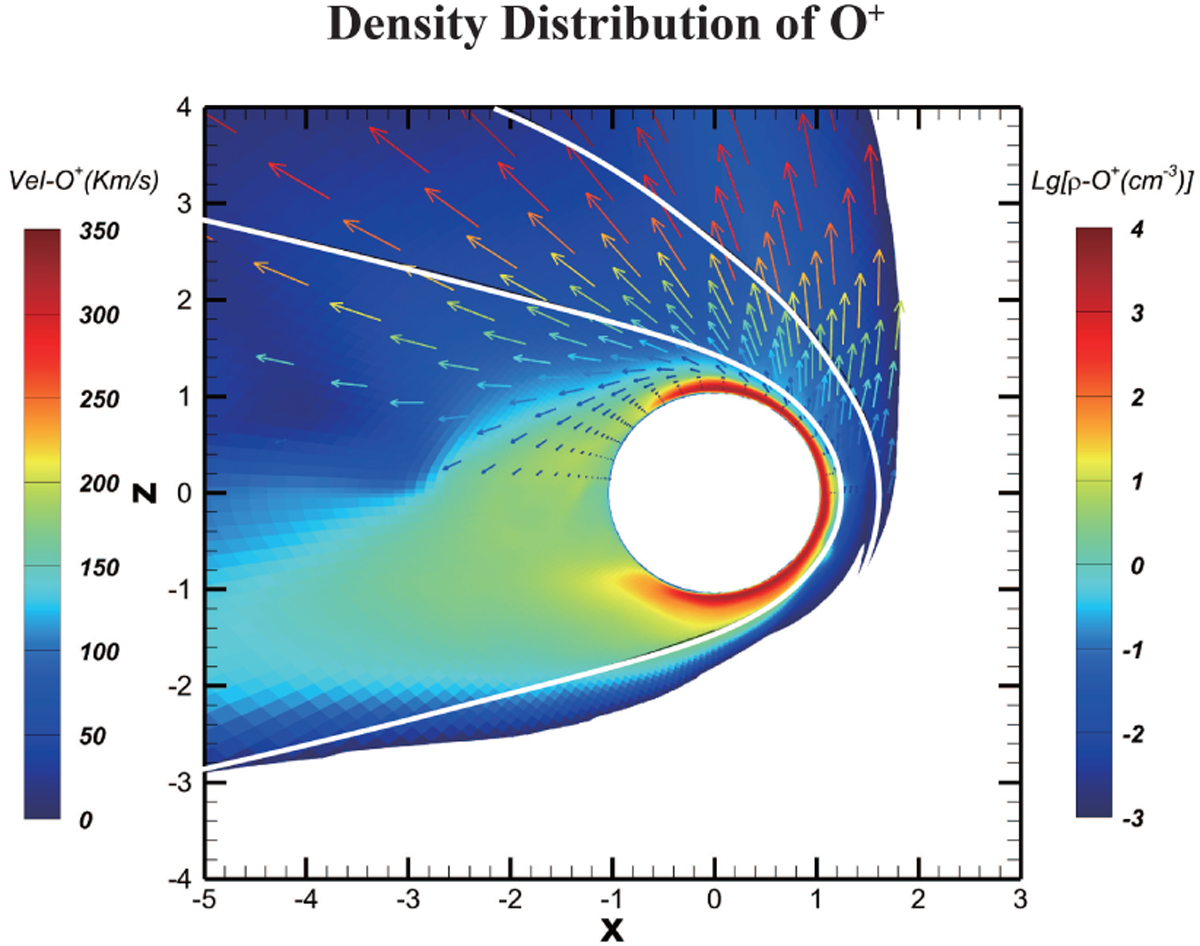
Density and velocity of O+ ions in the X − Z Plane. The color plot represents ion density; the areas where the oxygen ion density is less than 0.001cm−3 have been blanked out. The white lines represent the magnetic pileup boundary (MPB, internally) and the bow shock (BS, externally) according to the empirical model by Vignes et al. (2000). The arrows depict the velocity vectors of O+ ions.
Current usage metrics show cumulative count of Article Views (full-text article views including HTML views, PDF and ePub downloads, according to the available data) and Abstracts Views on Vision4Press platform.
Data correspond to usage on the plateform after 2015. The current usage metrics is available 48-96 hours after online publication and is updated daily on week days.
Initial download of the metrics may take a while.


