Fig. 6
Download original image
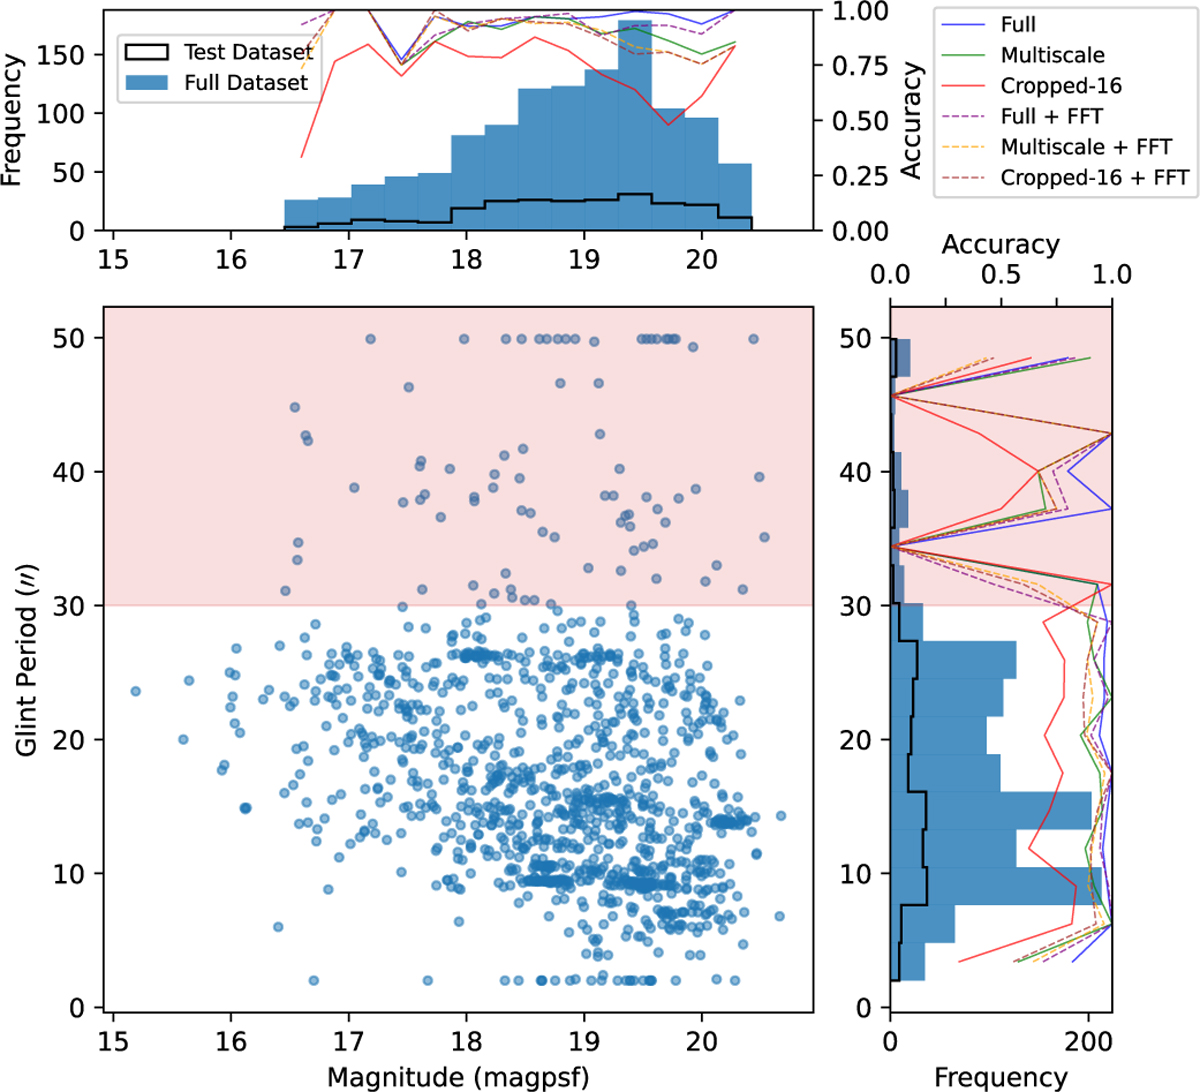
Distribution of magnitudes and estimated glint periods for our satellite dataset. The central scatter plot presents the full sample, with marginal histograms (blue: full sample, black outline: test subset). Colored lines show classification accuracy per model, ranging from 0 (no recovery) to 1 (perfect recovery). Due to the limited 63″ stamp FoV, glint periods ≳30″ are incompletely sampled (shaded region, see Sect. 4.2). The full model shows consistently high accuracy, whereas the cropped-16 model accuracy drops notably at ∼19.5 mag. FFT-based models show no glint-period bias, with only minor accuracy reductions at faint magnitudes.
Current usage metrics show cumulative count of Article Views (full-text article views including HTML views, PDF and ePub downloads, according to the available data) and Abstracts Views on Vision4Press platform.
Data correspond to usage on the plateform after 2015. The current usage metrics is available 48-96 hours after online publication and is updated daily on week days.
Initial download of the metrics may take a while.