Fig. 13.
Download original image
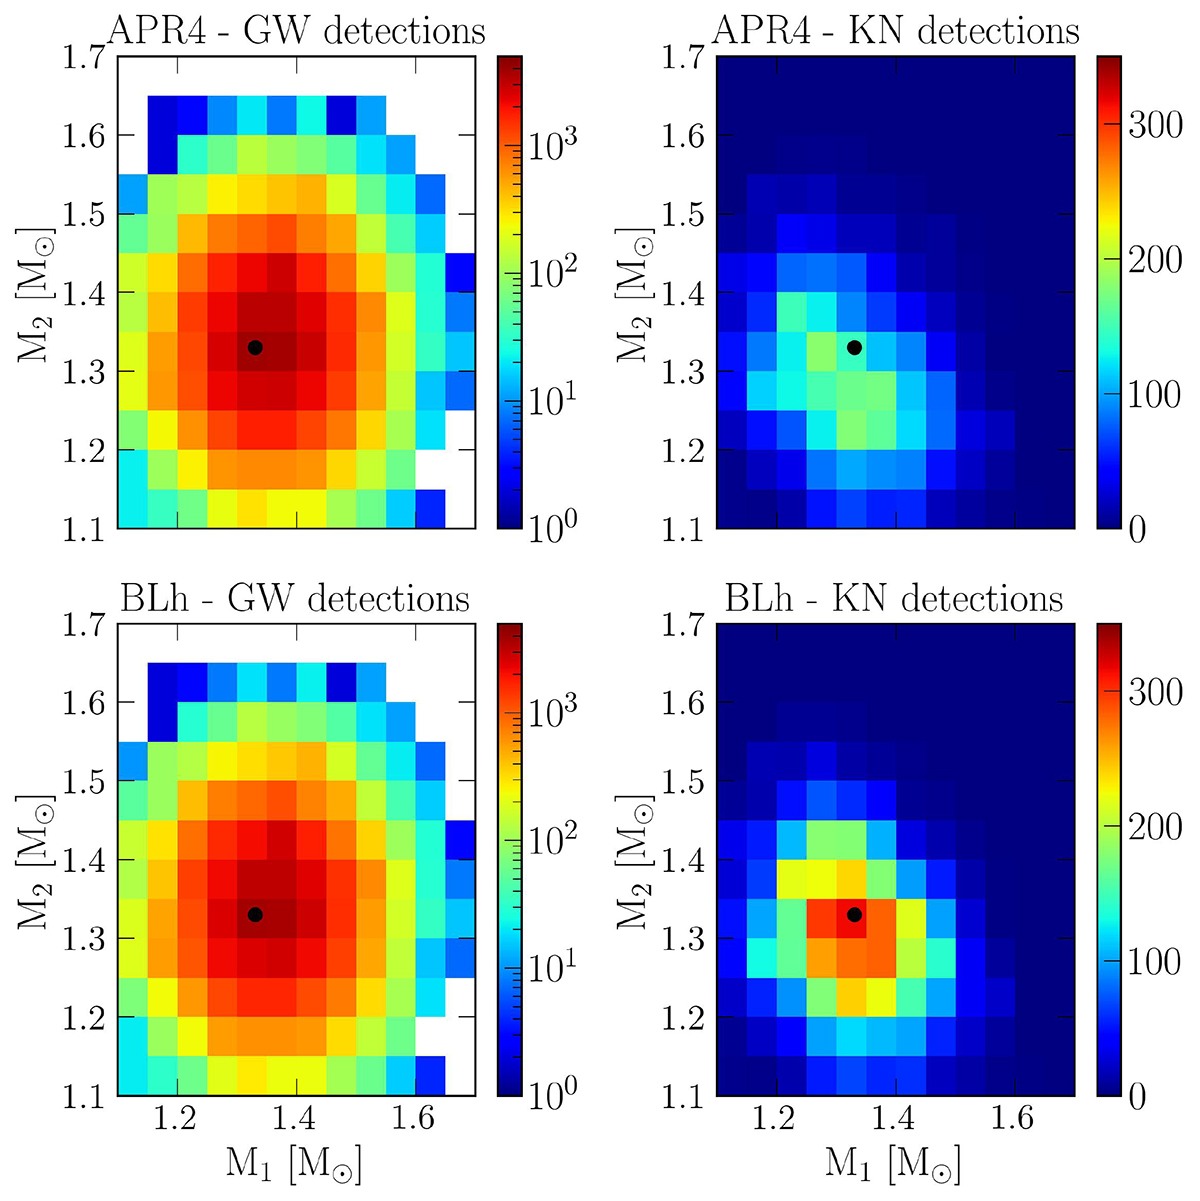
Number of GW and KN detections in the M1−M2 space. The colorbar indicates the number of GW detections with sky localisation Ω90<5 deg2 (left) and the number of corresponding KN detections for the 1ep detection strategy (right) obtained assuming APR4 (top) and BLh (bottom) EOSs, Gaussian NS mass distribution, α = 1.0, and GW network ET-Δ+2 CE. The black dot shows the peak of the Gaussian mass distribution, that is M1=M2 = 1.33 M⊙.
Current usage metrics show cumulative count of Article Views (full-text article views including HTML views, PDF and ePub downloads, according to the available data) and Abstracts Views on Vision4Press platform.
Data correspond to usage on the plateform after 2015. The current usage metrics is available 48-96 hours after online publication and is updated daily on week days.
Initial download of the metrics may take a while.