Fig. 5.
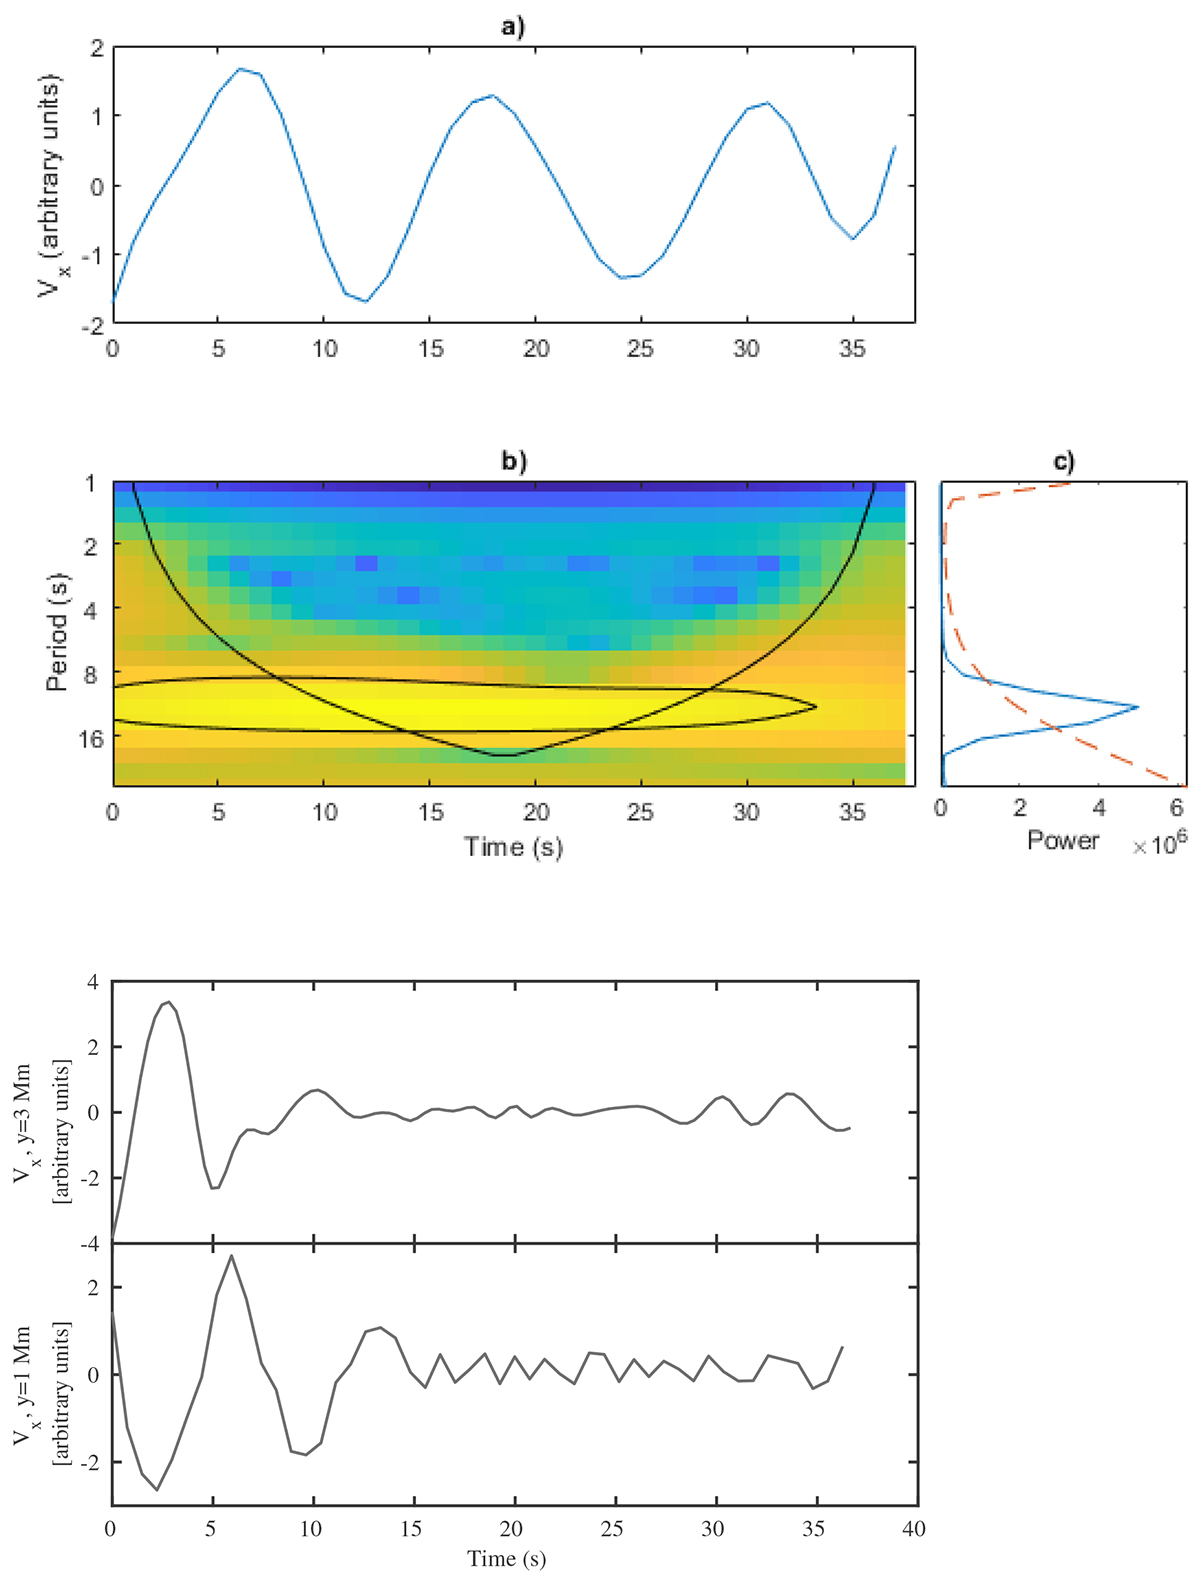
Download original image
Upper panel: (a) Time series of the velocity component variations Vx at y = 0.1 Mm. Time t = 0 corresponds to t = 60 s after the start of the simulation. (b) Wavelet power spectrum of the Vx time series. The solid line is the cone of influence. (c) Global wavelet power spectrum with a confidence level of 95% marked by the dashed red line. Bottom panel: Comparison of time series of variations in the velocity component, Vx at y = 3 Mm, 1 Mm.
Current usage metrics show cumulative count of Article Views (full-text article views including HTML views, PDF and ePub downloads, according to the available data) and Abstracts Views on Vision4Press platform.
Data correspond to usage on the plateform after 2015. The current usage metrics is available 48-96 hours after online publication and is updated daily on week days.
Initial download of the metrics may take a while.