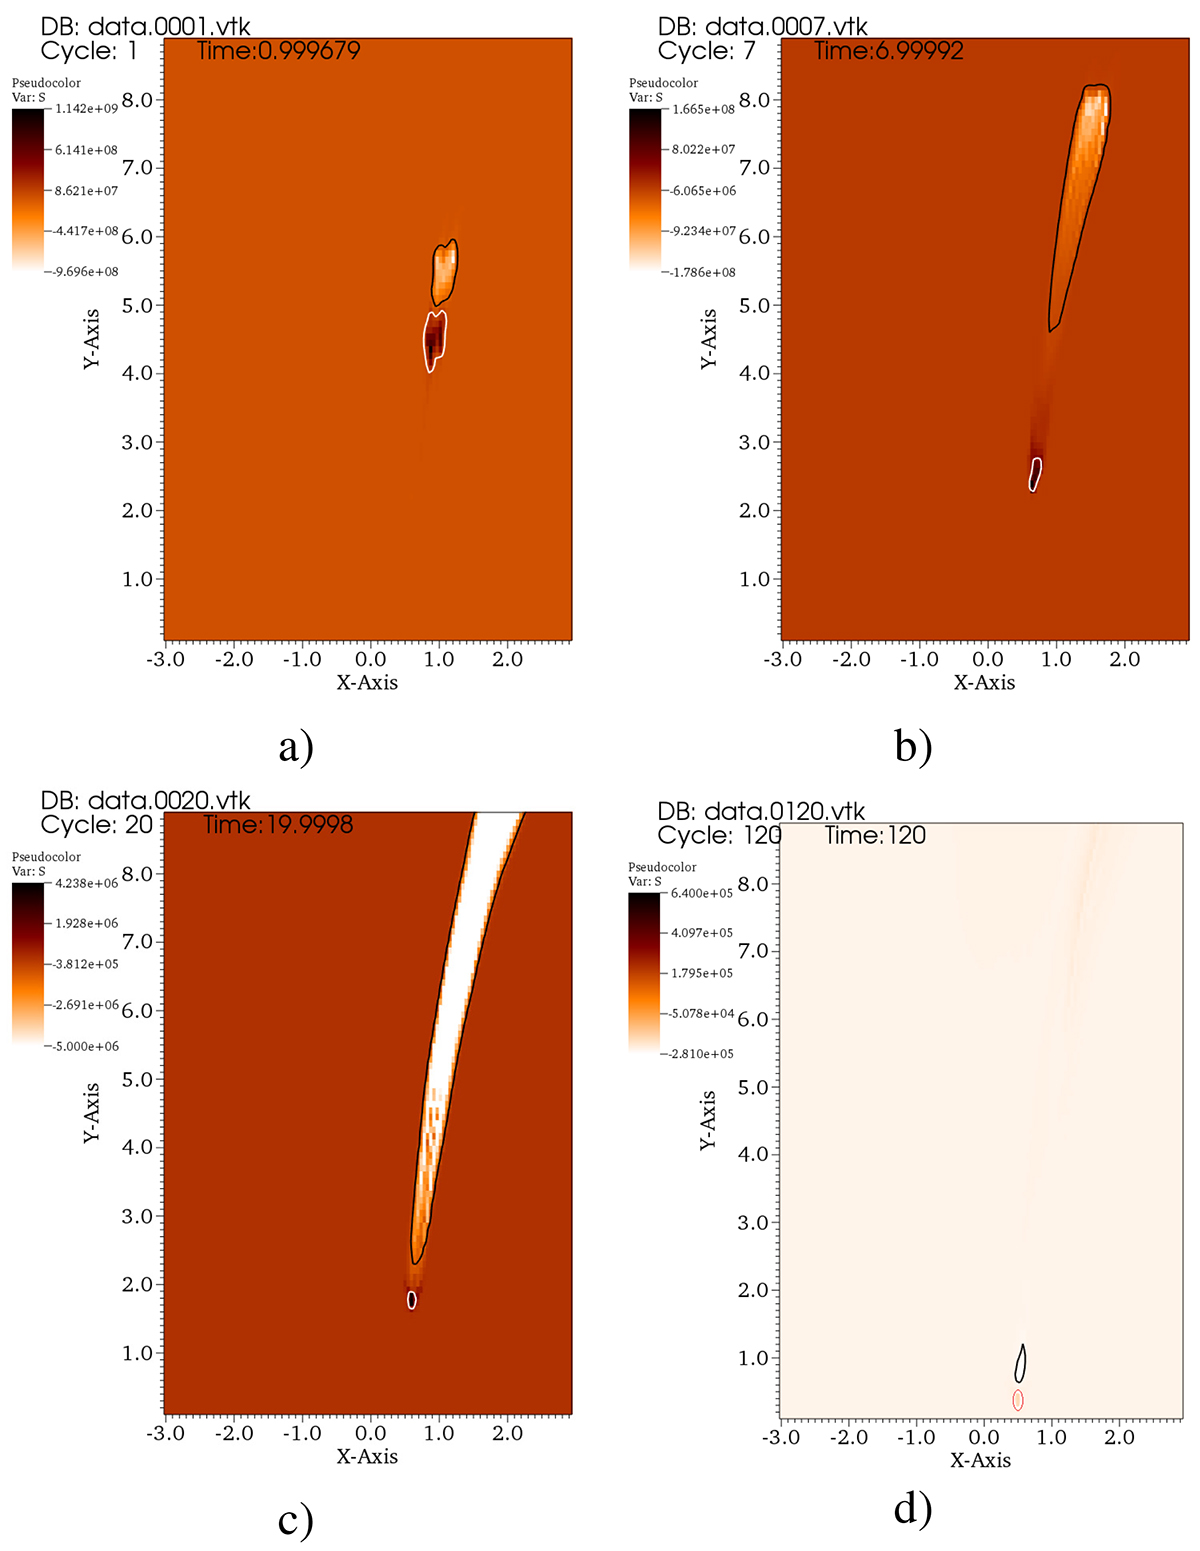
Fig. 4.
Download original image
Snapshots of the energy flux at t = 1 (a), t = 7 s (b), t = 20 s (c), and t = 120 s (d) at the start of the simulation. Contours illustrate the evolution of the disturbance during propagation. White and red contours show the location of the energy flux maximum, which propagates downwards. The black contour shows the energy flux that propagates upwards.
Current usage metrics show cumulative count of Article Views (full-text article views including HTML views, PDF and ePub downloads, according to the available data) and Abstracts Views on Vision4Press platform.
Data correspond to usage on the plateform after 2015. The current usage metrics is available 48-96 hours after online publication and is updated daily on week days.
Initial download of the metrics may take a while.