| Issue |
A&A
Volume 697, May 2025
|
|
|---|---|---|
| Article Number | A59 | |
| Number of page(s) | 18 | |
| Section | Stellar atmospheres | |
| DOI | https://doi.org/10.1051/0004-6361/202452840 | |
| Published online | 07 May 2025 | |
Abundance analysis of stars hosting gas-rich debris discs
1
Tartu Observatory, University of Tartu,
Observatooriumi 1,
Tõravere
61602,
Estonia
2
Space Research Institute, Austrian Academy of Sciences,
Schmiedlstrasse 6,
8042
Graz,
Austria
3
Institute for Theoretical and Computation Physics, Graz University of Technology,
Petersgasse 16,
8010
Graz,
Austria
4
Department of Physics and Astronomy, University College London,
Gower Street,
London WC1E
6BT,
UK
5
LIRA, Observatoire de Paris, Université PSL, CNRS, Université Paris Cité,
Sorbonne Université, 5 place Jules Janssen,
92195
Meudon,
France
6
Earth and Planets Laboratory, Carnegie Institution for Science,
5241 Broad Branch Road,
NW, Washington, DC
20015,
USA
★ Corresponding author; sandipan.borthakur@ut.ee
Received:
31
October
2024
Accepted:
20
February
2025
Context. Accretion from protoplanetary or debris discs can contaminate the stellar photosphere, especially in stars that have radiative envelopes. Due to the relatively slower photospheric mixing, these stars can exhibit clear contamination signatures. The contaminated photosphere reflects ongoing disc processes, which are detectable through stellar spectroscopy.
Aims. We investigate the composition of six gas-rich debris disc-hosting A-type stars to understand possible links with their debris disc or earlier accretion stages.
Methods. We used archival spectra and the ZEEMAN spectral synthesis code to estimate the stellar parameters and abundances of six debris disc-hosting A-type stars. We also estimated the stellar photospheric accretion contamination parameter, fph, using CAMSTARS, which indicates the fraction of accreting material on the stellar photosphere.
Results. The oxygen abundance in intermediate-mass stars decreases with age until the debris disc stage (<20 Myr), after which it could end up rising. The downward trend could result from H2O ice accumulating in dust traps or the formation of hydrated asteroids in the protoplanetary disc, locking oxygen in solids and reducing its accretion onto the star. All the stars share similar volatile abundances (C, O), but HD 110058 and HD 32297 exhibit refractory depleted abundances. The near-zero fph values in the six stars suggest that any currently accreted gas would not overwhelm mixing in the photosphere and would not impact the observed composition. The refractory depleted abundances in HD 110058 and HD 32297 suggest residual or even chronic, accretion contamination from their earlier protoplanetary stages when the accretion rates were about five orders of magnitude higher. For HD 110058, with the highest refractory depletion, we estimated a lower limit on its earlier protoplanetary accretion rate of 9 × 10⁻⁸ M⊙/yr, similar to other Herbig stars and equal to the Herbig star HD 100546. This supports our hypothesis that refractory depletion in HD 110058 originates from a prior phase of higher accretion of dust-poor material. We further develop this hypothesis by comparing HD 110058 with the HD 100546 protoplanetary disc system, which is of a similar age.
Key words: protoplanetary disks / stars: abundances / stars: atmospheres / stars: chemically peculiar / planets and satellites: formation
© The Authors 2025
 Open Access article, published by EDP Sciences, under the terms of the Creative Commons Attribution License (https://creativecommons.org/licenses/by/4.0), which permits unrestricted use, distribution, and reproduction in any medium, provided the original work is properly cited.
This article is published in open access under the Subscribe to Open model. Subscribe to A&A to support open access publication.
1 Introduction
Debris discs are circumstellar dust belts where planetesimal collisions continually replenish the dust. These discs are the next stage of evolution following the dissipation of protoplane tary discs. Several debris discs around early-type stars are known to contain substantial amounts of gas (Moór et al. 2013, 2017; Kral et al. 2020b). This gas could represent either residual primordial material from the protoplanetary disc (Kóspál et al. 2013) or secondary gas released from icy planetesimals (Kral et al. 2019). As the debris disc evolves viscously, some of this gas might partially accrete onto the host star (Kral et al. 2017).
The accretion of circumstellar material can cause a detectable composition peculiarity in the photosphere of stars with effective temperatures of Teff ≳ 6250 K (equivalently, masses, M* ≳ 1.4 M⊙, Jermyn & Kama 2018). Such stars have mostly radiative envelopes with relatively slower photospheric mixing than convection in low-mass stars. Alternatively, longer lived composition anomalies could result from the preferential removal of dust from accreting material in the protoplanetary disc stage (Kama et al. 2015).
Herbig Ae/Be stars are young, intermediate-mass (2 to 10 M⊙) stars with an accreting protoplanetary disc (Herbig 1960; Waters & Waelkens 1998). Following previous studies of proto-planetary discs and stellar abundances, Herbig Ae/Be stars have been separated into two distinct groups (Meeus et al. 2001). Stars with gaps in the protoplanetary discs (groupI discs) have (on average) photospheric abundances that are depleted ofrefractory elements, compared to stars with no gaps in the disc (group II discs, Kama et al. 2015). The volatile elemental abundances remain similar in both cases. All elements other than H, He, C, N, and O (volatiles) are considered here to be refractory. The ‘semi-volatile’ elements, such as Na, S, and Zn, with condensation temperatures in the 500 to 1000 K range, are also considered refractories, meaning that they are more likely to be locked in dust particles. The refractory depletion of stellar abundances hosting group I disc is thought to be caused by dust-poor accretion onto the star due to dust trapping at the outer edge of a disc gap or cavity (Kama et al. 2015). Stars with refractory elemental abundances depleted by a factor of 10–100 and volatile elemental abundances close to solar values are known as λ Boö-type peculiar stars (Morgan et al. 1943; Gray 1988).
The accretion rate (Ṁacc) for Herbig Ae/Be stars is of the order of 10−8−10−6 M⊙/yr (Grant et al. 2023), irrespective of disc gaps. These high accretion rates and relatively slow photospheric mixing cause significant pollution of the stellar photosphere and can leave clear signs in the observed stellar abundances (Folsom et al. 2012; Kama et al. 2015; Guzmán-Díaz et al. 2023). On the other hand, the observed gas-rich debris discs (discs with CO detection) will also accrete material onto the star, which can have chemical signatures different from those of protoplanetary discs. The calculated gas accretion rates of gas-rich debris discs around A-type stars are on the order of 10−13−10−11 M⊙/yr (Kral et al. 2017), that is, betwen three and five orders of magnitude lower than that of protoplanetary discs. Due to such low accretion rates, debris discs are unlikely to contaminate the stellar photosphere significantly (Turcotte 2002; Jermyn & Kama 2018). However, there have been scarcely any works focused on abundance anomalies in debris disc host stars. A correlation has been suggested between the λ Boö-type refractory-poor stars and dusty debris discs (Draper et al. 2016, 2018), but no targeted investigation has previously been carried out on the composition of stars hosting gas-rich debris discs.
In this paper, we analyse the stellar parameters and elemental abundances of six A-type stars with gas-rich debris discs. The goal is to investigate potential signs of accretion contamination from the debris disc or its earlier protoplanetary disc. We also compared the abundances ofour sample with HerbigAe/Be stars hosting protoplanetary discs. The stellar abundances in this paper are reported as log(Nel/NH), unless otherwise stated, where Nel and NH are number abundances of a specific element and hydrogen respectively.
The structure of the article is as follows: Section 2 describes the samples selected for the abundance determination. Section 3 details the spectroscopic data and the methods used to estimate stellar parameters and elemental abundances. Section 4 uses the stellar parameters and abundances to analyse accretion contamination on the stellar photosphere from the disc. Section 5 compares elemental abundances of debris disc-hosting stars with Herbig Ae/Be stars and discusses any link with photospheric contamination from the debris disc or its earlier protoplanetary disc. Section6 summarises our key findings.
Details of the six stars used for this study.
2 Sample selection
The following considerations have guided our sample selection: (1) the stars have a gas-rich debris disc with a high predicted gas accretion rate onto the star (Ṁacc M⊙/yr; Kral et al. 2017); (2) the stars should have radiative envelopes (Teff ≳ 6250 K), as their relatively slow mixing increases the chance of detectable photospheric “contamination” from gas accretion. Any deviations in the stellar surface composition from a normal reference composition might offer insights into past or ongoing accretion. Thus, these deviations provide information about the composition and evolution of the gas disc independently from direct observations. The resulting sample was not exhaustive, but due to data and analysis time limitations, we made the cut at six targets (with the highest gas accretion rates in our sample), with an extended sample to be studied in future work. Below, we briefly describe the six targets, summarising their properties in Table 1.
2.1 HD 21997
HD 21997 is an A3IV/V type debris-disc hosting star at a distance of 69.6 pc (Anders et al. 2022) belonging to the Columba association (Moór et al. 2013). The dust and CO gas mass of the disc are 0.27 ± 0.11 M⊕ (Moór et al. 2013) and 0.05–0.85 M⊕ (Cataldi et al. 2023; Higuchi et al. 2020), respectively. The CO gas disc has an inner radius of <26 au and an outer radius of 138± 20 au (Kóspál etal. 2013). The dustdisc has an innerradius of 55 ± 16 au and an outer radius of >490 au (unconstrained, Moór et al. 2013). The gas and dust discs are not spatially co-located. The dust is of secondary origin, produced through planetesimal collisions (Moór et al. 2013). Whether the gas is primordial or secondary is still a matter of debate (Cataldi et al. 2023). In addition, neutral C has also been detected in the disc (Cataldi et al. 2023).
2.2 49 Ceti
49 Ceti (HD 9672) is an A1V-type debris disc-hosting star at a distance of 58.3 pc belonging to the Argus moving group (Zuckerman & Song 2012). It has a nearly edge-on disc with a CO gas mass of 0.061–0.35 M⊕ (Cataldi et al. 2023). The millimetre (mm) dust grains are distributed from 100–310 au, peaking at ~110 au (Hughes et al. 2017). The dust mass of the disc is 0.068 ± 0.014 M⊕ (Hughes et al. 2017). The CO gas is distributed from 30–195 au (Higuchi et al. 2019). The central cavity is depleted in both dust and CO gas. The unusually high C/CO ratio in the disc suggests a secondary origin for the CO gas (Higuchi et al. 2017). Neutral C and O have also been detected in the disc (Higuchi et al. 2019; Roberge et al. 2014). A transient falling evaporating bodies-like (FEB-like) event has been detected, possibly due to perturbations by a planetary companion in the inner disc (Montgomery & Welsh 2012).
2.3 HD 131835
HD 131835 is an A2IV type debris disc-hosting star at a distance of 130.3 pc belonging to the Upper Centaurus Lupus sub-association of the Scorpius-Centaurus (Sco-Cen) association (Jang-Condell et al. 2015). It is a young, nearly edge-on debris disc-hosting star. The dust and CO gas mass of the disc is  and 0.045 ± 0.015 M⊕ respectively (Kral et al. 2019). The mm-dust disc belt radius is
  au with most of the mass within 50 and 140 au, albeit w−ith large uncertainties (Kral et al. 2019). The observations of micron-sized dust grains from the Spectro-Polarimetric High-contrast Exoplanet REsearch (SPHERE) instrument have revealed three concentric rings (Feldt et al. 2017). The outermost ring has an inner and outer edge of 85 and 120 au with a peak at 98 au. The middle ring has an inner and outer radius of 57 and 71 au, respectively, peaking at 66 au. The innermost ring is located at 35–45 au. Although a planetary companion can produce these rings, other methods (e.g. clumping instability, magnetised disc, etc; Feldt et al. 2017) can induce such structures too. No companion has been detected so far. The micron-sized dust grains are distributed over a larger range in radii compared to the more compact distribution of mm dust. The CO gas disc has inner and outer radii of 50 and 250 au, with a peak emissivity at ~100 au (Hales et al. 2019). The position of the gas ring matches the positions of the outermost dust rings. Neutral C has also been detected in the disc (Kral et al. 2019). The origin of the CO gas is considered to be secondary (Kral et al. 2019).
2.4 HD 138813
HD 138813 is a young A0V debris disc-hosting star at a distance of 130.3 pc belonging to the Upper Scorpius sub-association of the Sco-Cen association (Jang-Condell et al. 2015). The dust ring is located within  and
and  au (Lieman-Sifry et al. 2016). The CO gas disc is extended until ~ 181 au, although most of the gas is presentwithin 25–104 au (Hales et al. 2019). The dustmass of the disc is 0.0083 ± 0.0015 M⊕ (Lieman-Sifry et al. 2016). The mass of the CO gas in the disc is 0.000l–0.003 M⊕ (Hales et al. 2019).
2.5 HD 110058
HD 110058 is an A0V type star at a distance of 129.9 pc belonging to the Lower Centaurus Crux sub-association of the Sco-Cen association (Jang-Condell et al. 2015). It has an edge-on debris disc (Kasper et al. 2015). There are two different dust mass estimates of the disc:  (Hales et al. 2022) and 0.0028 ± 0.0002 (Lieman-Sifry et al. 2016). The CO gas mass of the disc is
  (Hales et al. 2022). The dust disc has an inner and outer radius of 18 au (<23 au with 99.7% confi-dence) and 67 ± 4 au, respectively, and a dust peak (planetesimal belt) at
  au (Hales et al. 2022; Stasevic et al. 2023). The CO gas disc spans 10–30 au with a peak radius at ~10–20 au (Hales et al. 2022). The gas is expected to be of secondary origin formed through collisions of planetesimals. The inner disc is tilted in comparison to the outer disc, suggesting perturbation by a massive planet on an inclined orbit in the inner disc (Stasevic et al. 2023). The CO gas distribution in the inner cavity could either be explained by a low viscosity level or the effect of a massive planet carving the inner cavity and accreting the inflowing gas (Hales et al. 2022).
2.6 HD 32297
HD 32297 is an A0V type edge-on debris disc-hosting star at a distance of 132.4 pc. The mm-dust has a two-component structure, namely: (i) a planetesimal belt between 78.5 ± 8.1 au and 122 ± 3 au and (ii) an outer halo from 122 ± 3 au to 440 ± 32 au (MacGregor et al. 2018). The outer halo consists of smaller dust grains (Olofsson et al. 2022). The millimetre-sized (mm-sized) dust mass in the belt is 0.57 ± 0.05 M⊕ and the micron-sized dust mass in the halo is 0.29 ± 0.06 M⊕ (MacGregor et al. 2018). The CO gas mass in the disc is  (Cataldi et al. 2023). Although mm-dust and gas images− show no asymmetry, observations of micron-sized dust grains reveal an asymmetric disc with a swept-back wing-like structure (Schneider et al. 2014), which extends out to ~1560 au. The disc has an asymmetric concavity at larger radii. These complex structures in the discs are poorly understood and their origins can be affected by interaction with a dense interstellar medium (ISM) and/or intrinsic perturbations. The CO gas is co-located with the dust continuum. The observations from the Atacama Large Millimeter/submillimeter Array (ALMA) have detected a neutral C ring at ~110 au with a fullwidth half maximum (FWHM) of ~80 au (Cataldi et al. 2020), slightly extended compared to the planetesimal belt. There has been the detection of Na absorption from the circumstellar disc and slight variability in the radial velocity as well (Redfield 2007). Such absorption can be due to FEBs or exocomets.
3 Data and analysis
We retrieved archival spectra for each of the six stars. The spectra of 49 Ceti were observed using the Echelle SpectroPolarimetric Device for the Observation of Stars (ESPaDOnS) attached to the Canada France Hawaii Telescope (CFHT), with a spectral resolution of ~65 000. The data are available on the Polarbase website1. The spectra for HD 21997, HD 131835, HD 138813, HD 110058, and HD 32297 were observed using the Fiber-fed Extended Range Optical Spectrograph (FEROS) mounted on the Max-Planck-Gesellschaft (MPG) 2.2 m telescope in La Silla, Chile, with a spectral resolution of ~48 000. The data are available on the European Southern Observatory (ESO) Archive Science Portal2. Multiple spectra from the same instruments were combined for each star to improve the signal-to-noise (S/N) ratio. Details on the analysed spectra are given in Table B.1.
The stellar temperature (Teff) and surface gravity (log g) were first estimated using photometric calibrations. Using these estimates as initial values, we derived the final stellar parameters and elemental abundances using spectral fitting. Finally, we tested the quality of our Teff and log g estimates by comparing theoretical and observed colours. Below, we list a detailed description of the analysis.
Teff and log g estimates from photometric calibration.
3.1 Photometric calibration
As a first estimate for effective temperature (Teff) and surface gravity (log g), we used photometric colours from Mermilliod et al. (1997)3 and the TEMPLOG G (Kaiser 2006) software, which estimates stellar parameters from empirical photometric calibrations. The photometric systems and the calibrations used are listed in Table 2. All stars except HD 32297 had photometric colours in at least one of the three photometric systems (Strömgren, Johnson, or Geneva).
3.2 Spectrum fitting
The ZEEMAN spectral synthesis code (Landstreet 1988; Wade etal. 2001; Folsometal. 2012) was used for the spectral fitting, along with ATLAS9 (Kurucz 1993; Castelli & Kurucz 2004) stellar model atmospheres and a list of atomic line data from the Vienna Atomic Line Database4 (VALD; Piskunov et al. 1995; Ryabchikova et al. 1997; Kupka et al. 1999, 2000; Ryabchikova et al. 2015). ZEEMAN is a Fortran-based spectral synthesis code which estimates stellar parameters and elemental abundances by fitting a continuum normalised spectrum using χ2-minimisation. The code assumes local thermodynamic equilibrium (LTE) in the stellar atmosphere. The spectra were continuum normalised using SUPPNET5 (Różański et al. 2022). SUPPNET is a Pythonbased neural network code approximating the continuum as a spline. The interactive interface allows the user to tweak the continuum to their preferences. Using the continuum normalised spectrum, the stellar parameters – Teff, log g, projected rotational velocity (ν sin i), microturbulence velocity (νmic), radial velocity (νr), and the stellar elemental abundances were derived using a multi-step procedure. The Teff and log g values were initialised either using the photometric estimates from the previous section (Table 2) or a typical value of 8000 K and 4.0 dex (for HD 32297), respectively. The νr and ν sin i values were initialised using rough estimates from manually comparing synthetic spectra with the observations. The initial values of the stellar abundances were assumed to be solar. We initialised the νmic value using the formula from Pace et al. (2006)

The spectrum was first divided into multiple smaller wavelength regions. For HD 21997, we used the spectral regions: 4169–4606 (excluding the Hγ region), 4606–5187 (excluding the Hβ region), 5187–5387, and 5387–5672.01 Å. For 49Ceti, HD 131835, HD 138813, HD 110058, and HD 32297, we used the spectral regions: 4439–4760, 4976–5176, 5176–5376, and 5376–5673 Å. In our first run, we did not use the spectrum beyond ~5600 Å, which has wiggles in the continuum, (possibly due to bad order merging), making it difficult to normalise the spectrum. This was true for all FEROS spectra used in our analysis. To maintain a similar analysis, we also used the same method for the ESPaDOnS spectrum (49 Ceti). We fit each spectral region independently for the stellar parameters (Teff, log g, ν sin i, νmic, and νr) and abundances. We fit each stellar parameter individually. After estimating the stellar parameters, we fit together the abundances of elements showing the strongest and the largest number of absorption lines in the spectral regions (e.g. Fe, Ti, Cr). One iteration occurs when one round of the fit for all the parameters and the abundances is done. We iterate until all parameters and abundances converge, which typically happens with 3–4 iterations. The uncertainties of the stellar parameters and the abundances measured in this run were based on the standard deviation of their values obtained from these different wavelength regions.
Using the estimated stellar parameters, we re-normalised the spectrum, including wavelength regions beyond 5600 Å. During the continuum normalisation, we compared our normalisation with a synthetic normalised spectrum. The synthetic spectrum was produced using ZEEMAN and the stellar parameters and the abundances from the first run. This allowed us to remove complex wiggles in the continuum without significantly affecting the line depths of absorption lines. We fixed the stellar parameters and the abundances of elements measured from the first run. In this second run, we estimated the abundances of all other elements (e.g. Sc, C, and O), which were not estimated in the first run. Since most lines are blended, to determine the abundance of an element from a spectral line, we fit the spectral region around that line while fixing the abundances of the other elements. These spectral regions are ≲10 Å and are much smaller than the spectral regions fit in the first run. Their uncertainties were based on a standard deviation of their line-by-line estimates. For elements with abundance measurements from a single line, we assigned a standard uncertainty of 0.20 dex.
3.3 Colours
To check the reliability of our Teff and log g estimates, we compared the synthetic colours to the observed ones. The Strömgren colours (b - y) and c1 are particularly sensitive to Teff and log g, respectively. A difference of less than 0.05 between the synthetic and observed colours corresponds to estimated uncertainties of 50 K in Teff and 0.05 dex in log g. The synthetic colours were derived from combining the spectral energy distributions (SEDs) computed by LLMODELS (Shulyak et al. 2004) using the atmospheric parameters obtained from spectroscopy with filter transmission curves. We did not account for measurement errors in the stellar parameters and abundances when calculating the synthetic colours. The observed colours were only available for HD 21997,49 Ceti, and HD 138813, which were corrected for interstellar reddening.
We used the publicly available NASA Galactic Dust Reddening and Extinction map6, which is based on the data from Schlafly & Finkbeiner (2011) and Schlegel et al. (1998). Table 3 lists the E(B - V) values for HD 21997 and 49Ceti. The E(B - V) for HD 138813 is reported as 0.2935 ± 0.0315 (Schlafly & Finkbeiner 2011) and 0.3413 ± 0.0366 (Schlegel et al. 1998). Applying a E(B - V) of 0.30 on the synthetic colours of HD 138813 gives a difference between the synthetic and observed colours of > 0.20. To resolve this issue, we compared the flux-calibrated X-shooter spectrum available in the ESO archive science portal with a flux-calibrated synthetic spectrum produced using LLMODELS (Shulyak et al. 2004) based on our Teff and log g estimates. Based on this comparison, we found E(B - V) = 0.04 for HD 138813. The discrepancy in the E(B - V) value likely arises because the dust map does not consider the distance to the star. As a result, the dust cloud could be located behind the star, leading to an overestimation of the extinction. Figure 1 shows the difference between synthetic and observed colours for HD 21997, 49 Ceti, and HD 138813, where we used the revised E(B - V) of 0.04 for HD 138813.
Extinction parameters used to correct the observed colours.
4 Results
In this section, we describe the stellar parameter and abundance estimates for the six stars in our sample. An example of our spectral fitting is shown in Figs. 2 and A.1, in a narrow wavelength range for the six stars. The resulting averaged best-fit values are listed in Table 4. The abundances are compared to the Sco-Cen reference abundance listed in Table 4 and discussed in detail in Sect. 4.2. The abundances for our sample of stars are plotted in Fig. 3, along with the Sco-Cen reference abundances (see Sect. 4.2) for different elements. In the figure, the x-axis is ordered by increasing condensation temperature (from left to right and top to bottom).
HD 21997: this star has the lowest ν sin i value in our sample. All abundances are close to our reference abundance from Sco-Cen association members.
49Ceti: this star has the highest vsini of 196.9 km/s. Most absorption lines are heavily blended, making the abundance estimates for some elements more uncertain. All the abundances are close to the Sco-Cen reference abundance.
HD 131835: all elemental abundances are similar to the Sco-Cen reference abundance.
HD 138813: the hottest star in our sample. The abundances are similar to the Sco-Cen reference abundance.
HD 110058: the coolest star in our sample. The abundances show a high depletion of abundances of refractory elements. The volatile abundances are close to the Sco-Cen reference abundance. It is a λ Boö-type chemically peculiar star.
HD 32297: this star also shows refractory depletion, whereas the volatile abundances are similar to the Sco-Cen reference abundance. It is a λ Boö-type chemically peculiar star.
The new stellar parameters and elemental abundances are analysed using the CAMSTARS7 (Jermyn & Kama 2018) accretion contamination model to derive constraints on the mass accretion history of individual systems. Investigating accretion contamination can reveal dust-poor accretion from a gas-rich debris disc or an earlier transitional protoplanetary disc with a strong dust trap. The accretion contamination from a protoplanetary disc with a strong dust trap would manifest as depletion of all elements that are sequestered away into trapped solids and thus unable to accrete with the viscous, volatile-rich gas disc.
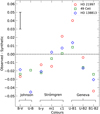 |
Fig. 1 Observed-synthetic colours for different photometric systems. Better Teff and log g estimates produce a difference closer to zero. The top-left corner includes a typical uncertainty in observed colours. The colour difference for HD 138813 is based on E(B - V) = 0.04. |
4.1 Contamination from accreting material
The contamination of the stellar photosphere by the accreting material is represented by the following equation:

where

Here,  is the observed abundance measured in this paper (Table 4),
  is the abundance of the accreting material, (HJ) is the reference abundance representing the stellar abundance without accretion contamination, fph is the accretion contamination parameter, Ṁacc is the gas accretion rate, and Dph is the diffusion coefficient. Although we report all tlie abundances in logarithmic terms, Eq. (2) requires
  ,
,  , and
, and  to be absolute ratios of number densities. We used CAMSTARS to estimate fph, which also provides the Dph value for the star. The Dph for an A-type star is dominated by rotational mixing, which is much slower than the convective mixing in cooler stars. Rotational mixing depends on stellar Teff, log g, and equatorial rotational velocity (ν). Stars with higher ν will have more efficient mixing due to higher values of Dph and, thus, they will have a lower fph. Since we could only estimate ν sin i (≤ν), we only got an upper limit on the fph value (Table 1).
To calculate the fph values of our stars, CAMSTARS also needs their Ṁacc (Table 1). We used the model described in Kral et al. (2017) to calculate the gas accretion rates onto the stars. In this model, the gas in the debris disc is considered secondary (produced by planetesimal collisions) because any primordial gas would be photodissociated on a timescale of ~ 100 years from the interstellar UV radiation and would not be detectable (Kral et al. 2017). The gas is continuously released in the planetesimal belt, which can then spread onto the star, as in the case of a typical accretion disc. In the steady state, the gas release rate from the planetesimal belt is the accretion rate. The accretion rate can then be represented as Ṁacc =  where MCO is the gas mass observed for the disc and ts is the survival timescale of the gas before it dissociates. We adjusted the gas release rate to fit the observed gas mass for the disc. We estimated the CO gas mass by fitting the CO lines assuming LTE. We used the ALMA observations of 12CO and ifavailable also its isotopologues (e.g. 13CO and C18O). In cases where neutral C observations were available from ALMA, we used those as well. For the most massive discs, we account for neutral carbon shielding that can enhance the CO lifetime to fit the gas release rate (Kral et al. 2019). Hence, in the most massive discs (≳10−2 M⊕), CO can be shielded sufficiently to start spreading onto the star together with carbon and oxygen. Instead, in less massive discs, only the atomic species are expected to be able to reach the star. We note that a fraction of the gas could also be accreted by planets located between the belt and the star (Kral et al. 2020a), which is not accounted for here.
To calculate the uncertainty on Ṁacc, we have to account for the uncertainty on MCO and ts , where the latter is dominant. The survival timescale for the gas, ts depends on the exact quantity of CO, carbon and their radial distributions, which can affect CO self-shielding or carbon-shielding, at leastforthe most massive discs. Refining these estimates requires high-resolution imaging, such as with ALMA. Although it is difficult to assign a formal uncertainty to the accretion rates, a previous work by
Kral et al. (2019) on HD 131835 suggested a conservative uncertainty of a factor of 10. For more massive discs, the CO mass is usually derived from isotopologues, but accurately determining 12CO mass requires knowledge of isotopologue ratios, which remain uncertain; we currently assume ISM ratios. Since fph is directly proportional to Macc (Jermyn & Kama 2018), its values will also have an uncertainty of a factor of 10.
Stellar parameters and elemental abundances for our sample of six debris disc-hosting stars.
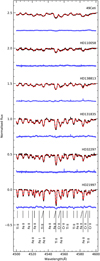 |
Fig. 2 Spectral fitting of the debris disc host star sample. The spectra are shifted vertically for better visualisation. Black represents the observed spectrum, red represents the best-fit synthetic spectrum, and blue represents the difference between the observed and synthetic spectrum. The spectra are sorted in increasing order of ν sin i value from bottom to top. |
Sco-Cen association members used from literature for reference abundance.
4.2 Reference abundance
To quantify the change in the stellar abundances due to accretion, we need a reference abundance indicating the stellar abundance without contamination. Since all stars in our sample are in the solar neighbourhood (d ≲ 150 pc), we can use the typical composition of nearby stars as our  . The abundance of He, C, N, O, Ne, Mg, Si, and Fe is uniform in stars within the solar neighbourhood (Nieva & Przybilla 2012). Furthermore, three out of six stars in our sample belong to the Sco-Cen association (d ≈ 130 pc). Based on these considerations, we used the composition of Sco-Cen association members from the literature (Table 5) to extend the list of reference abundances to other elements. We divided the sample into cool (Teff > 6250 K, convective envelope) and hot (Teff > 6250 K, radiative envelope) stars. The results are independent of the exact location of this boundary since the hottest star in the cool sample is 5700 K and the coolest star in the hot sample is 6500 K. We used the median abundance of each element from the hot star sample in Sco-Cen (Table 5) as the
  for our sample. Taking the median abundance of each element cancels out the effects of any outliers, which, in our case, is due to λ Boö-type peculiar stars (e.g. HD 139614 and HD 142666, see Table B.4) in the Sco-Cen sample. Table 5 also lists the references for the abundance values for both the hot and cool Sco-Cen sample. Figure 3 compares the Sco-Cen abundances with the debris disc-hosting stars analysed here. The uncertainty on the reference abundance is the standard deviation on the abundances of the Sco-Cen members (Table 5).
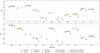 |
Fig. 3 Comparing the elemental abundances of debris disc host stars (this work) with that of similar stars in the Sco-Cen association (see Table 5) as reference. The yellow and grey circles represent individual Sco-Cen association members. The stars represent the median abundance of the Sco-Cen association members. The x-axis is in increasing order of elemental condensation temperature. The condensation temperature also increases from the top to the bottom panel. The volatile abundances (C, N, O) show no depletion for all stars. The refractory abundances are depleted in HD 110058 and HD 32297, likely due to dust-poor material accretion from their early protoplanetary discs. |
5 Discussion
5.1 Composition versus age
We compared the abundances of protoplanetary disc-hosting stars (Folsom et al. 2012; Kama et al. 2015, Table B.2) with the debris disc-hosting stars as a function of age.
Volatiles versus age: The volatile elements considered here are C and O. The C abundance versus age plot in the top panel of Fig. 4 indicates that the average carbon abundance in stars hosting protoplanetary discs and debris discs is similar. The O abundances vs age plot in the bottom panel of Fig. 4 reveals that young debris disc-hosting stars (<20 Myr) in our sample have a slightly lower average oxygen abundance compared to proto- planetary disc-hosting stars. The reason for the downward trend of the O abundance with age for the young stars is still an open question. The trend might be related to the accumulation of H2O ice in dust traps, prohibiting the accretion of O. Alternatively, the formation of hydrated planetesimals (e.g. via streaming instability) beyond the snowline can reduce the amount of O available to accrete onto the star, thus depleting the stellar O abundance. These hydrated planetesimals (or asteroids) are observed in our Solar system and have been theorised to provide water to the solar system planets (Kral et al. 2024). The water can also accrete onto the star, potentially increasing O abundance during the debris disc stage (Kral et al. 2024). The potential upward trend after the young debris disc stage can be explained by the rotational mixing of the previously accreted material at the stellar photosphere with the inner layers of the envelope, which will bring the observed O abundance to the actual stellar abundance without the contamination.
Refractories versus age: Fe is used as the representative for all the refractory elements in our sample. The Fe abundance versus age plot shown in Fig. 5 indicates that the average elemental composition of the young debris disc-hosting stars is similar to that of the group I protoplanetary disc-hosting stars. Instead, the older stars in our sample have abundances close to our reference abundance (and the group II protoplanetary disc host stars) within the uncertainties. The young debris disc-hosting stars show a wide range of Fe abundances, from values similar to the reference abundance to being depleted by up to ~ 1 dex. This is similar to group I protoplanetary disc-hosting stars, which are on average Fe-depleted, although some match the reference abundances.
5.2 A possible depletion signature from the protoplanetary disc stage
The theoretical fph values calculated for all six stars are very low (last column in Table 1) due to the low accretion rates. This implies that the current debris discs cannot contaminate the stellar photospheres. Even if the fph values increased by a factor of 10, equivalent to the typical uncertainty, the change in the observed abundance would be ≤0.01 dex, which is below the accuracy of our abundance measurements. The depletion of refractory elements we observe for some of the stars in our sample, as shown in Fig. 3, needs an alternative explanation. The accretion rates for most HerbigAe/Be stars are ~10−8 to ~10−6 M⊙/yr (Grant et al. 2023). Comparing that to the accretion rates of these debris disc-hosting stars, which are in the order of 10−12 M⊙/yr, we propose that the depletion of refractory elements in our sample stars is a signature from the material that was accreted during their protoplanetary disc stage. Such a ‘chronic depletion’ inherited from the gas-rich protoplanetary disc stage has been suggested before as an explanation for severely refractory-poor early-type stars, such as the λ Boö chemically peculiar stars (Kama et al. 2015; Jermyn & Kama 2018).
The origin of this refractory depletion is associated with the accretion of dust-poor material. The formation of giant planets opens up gaps in the protoplanetary discs (group I discs). The gap produces a pressure maxima at its outer edge, preventing the heavier mm-sized dust grains from moving inward, while allowing the gas to flow freely and accrete onto the star (Rice et al. 2006; Pinilla et al. 2012). This dust-poor accretion produces the refractory depletion in stellar abundances of the group I disc hosts. Stars hosting protoplanetary discs with no gaps (group II discs) have no change in their stellar abundances because they accrete both dust and gas. Figure 5 shows the evolution of the stellar abundances for both group I (red) and group II (blue) protoplanetary disc-hosting stars. Once the protoplanetary disc evolves into the debris disc, the accretion rate is too low to contaminate the stellar photosphere. Then stellar rotational mixing dominates and the refractory depleted abundances observed in group I disc hosts slowly disappear within ~20 Myr (Jermyn & Kama 2018). The evolution curves in the figure illustrate this idea qualitatively, for the refractory stellar abundances in group I and group II protoplanetary disc host stars.
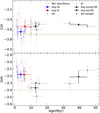 |
Fig. 4 Volatile abundance vs age plots. Top panel: C vs age plot, Bottom panel: O vs age plot. GI and GII mean group I and group II protoplanetary disc-hosting stars, respectively. DD stands for debris disc-hosting stars. |
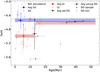 |
Fig. 5 Fe abundance vs age plot. Red curve and blue curve represents evolution of stellar Fe abundance for stars with group I and group II protoplanetary discs, respectively. DD S21: Young debris disc-hosting stars HD 169142, HD 120326, β Pic, HR 8799, and HD 95086 from Saffe et al. (2021). The abbreviations are described in Fig. 4. |
5.3 Different accretion rates of HD 110058
HD 110058 shows the highest depletion in refractory elements in our sample. The theoretically calculated fph value for this star is almost zero (1.42 × 10⁻⁶, Table 1) due to the low accretion rate from the debris disc. This near-zero fph value implies that the debris disc accretion cannot alter the bulk composition of the photosphere. On the other hand, substituting the observed and reference abundances in Eq. (2), we can calculate the range of observed fph and  values that satisfy the equation:
![$\left(\frac{X}{H}\right)_{\rm acc} = \frac{1}{f_{\rm ph}}\left[\left(\frac{X}{H}\right)_{\rm obs} - \left(\frac{X}{H}\right)_{\rm ref}\right] + \left(\frac{X}{H}\right)_{\rm ref}\,.$](/articles/aa/full_html/2025/05/aa52840-24/aa52840-24-eq25.png)
The top panel of Fig. 6 plots the range of different  and fph values that satisfy Eq. (4) for different refractory elements. The equation is satisfied for the range of fph values, which give a positive
  . Since the abundances used in the equation are in absolute number density ratios and not logarithms (Sect. 4.1), the value of
  in the equation cannot be negative.
To interpret the results from the fph range calculations from different elements, we can take the example of Sc and Fe. Sc gives a range of fph values from 0.68–1, which means at least 68% of the stellar photosphere is contaminated by the accreting material. We find that Fe gives us a much stronger constraint on the fph value of 0.92–1, implying at least 92% of the photosphere is contaminated. Of all the elements, Fe gives us the highest lower limit on the observed fph. This lower limit on the observed fph value of 0.92 is quite different from the theoretical fph value of 1.42 × 10⁻⁶ (Table 1), calculated based on the current accretion rate and diffusion coefficient.
For each element, we also considered the uncertainty in our measured  while calculating the range of
  values. This is shown as different curves for each element in Fig. 6. As discussed in Sect. 4.1, the fph parameter depends on the equatorial rotational velocity of the star. Since we only measured ν sin i, we needed an estimate of the stellar inclination angle, i. The debris disc of HD 110058 is almost edge-on (Hales et al. 2022). Assuming that the star-disc system is aligned, we can consider i ≈ 90°, implying our ν sin i estimate is the equatorial rotational velocity of the star.
The fph parameter is a function of Ṁacc, so we can invert this relationship to infer a lower limit of ~9 × 10⁻⁸ M⦙/yr for Ṁacc (bottom panel of Fig. 6). This high accretion rate is comparable to the accretion rates of Herbig stars (bottom panel of Fig. 6). Comparing this value to the current accretion rate of HD 110058 of 1.42 × 10 13 M⦙/yr implies that the refractory depleted material contaminating the stellar photosphere of HD 110058 is most likely to be from its protoplanetary disc stage.
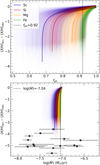 |
Fig. 6 Range of |


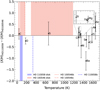 |
Fig. 7 Difference between stellar abundances of HD 110058 and HD 100546 in increasing order of condensation temperature. The abundances are on a logarithmic scale. The highlighted regions in red (top) and blue (bottom) represent the radial disc’s mid-plane dust temperatures for HD 100546 and HD 110058, respectively. For HD 100546, we used the mid-planet dust radial temperature profile from Keyte et al. (2024). For HD 110058, we used the Stefan Boltzmann law and stellar luminosity to estimate the radial temperature profile for the debris disc and giant planet. The vertical lines indicate the temperatures at the position of the planets (confirmed or predicted) in the radial disc temperature profiles around both stars. |
5.4 Comparison between HD 100546 and HD 110058
The planetesimal belts that supply debris discs likely originate from massive dust rings in protoplanetary discs, where planetesimals can form in large numbers via the streaming instability. The instability produces pebble overdensities that can be unstable to direct gravitational collapse into large planetesimals (Youdin & Goodman 2005; Johansen et al. 2009). It is, therefore, interesting to note the following links between two similarly aged stars of similar types in Sco-Cen that have discs apparently on opposite sides of the protoplanetary versus debris disc boundary.
HD 100546 is a protoplanetary disc-hosting star with an effective stellar temperature of Teff= 10500 K (Kama et al. 2016). It belongs to the Lower Centaurus Crux (LCC) of the Sco-Cen OB association (Jang-Condell et al. 2015). The main features of the dust disc include: an inner cavity with a radius of ≈ 22 au and two main dust rings, from 22 to 40 au and 150 to 230 au (Keyte et al. 2024). There is another small dust ring at ≲1 au (Keyte et al. 2024), shown in Figs. 7 and 8, but is not considered in this discussion. The refractory stellar abundances of HD 100546 are the lowest in the protoplanetary disc-hosting star sample assembled from Folsom et al. (2012) and Kama et al. (2015), and the abundances are comparable to those of HD 110058 (Fig. 7).
Since both HD 100546 and HD 110058 belong to LCC, the composition of the initial material from which both these systems were formed should be similar. The calculated accretion rate of HD 100546 is  M⦙/yr (Fairlamb et al. 2015), which is close to the earlier protoplanetary disc accretion rate of HD 110058 (see Sect. 5.3) within the uncertainties. Both stars are also suspected to have a Jupiter-sized planet in the innermost regions of the disc (Pinilla et al. 2015; Stasevic et al. 2023, Fig. 8). These similarities might indicate that the inner disc around HD 110058 is the next stage of evolution of HD 100546 and thus, HD 110058 has recently transitioned into the debris disc phase. The similar level of depletion in refractory abundances (Fig. 7) in both stars can be due to similar strengths in the dust traps at similar locations (Fig. 8). The strength and location of the dust trap in both stars might be associated with the previously predicted innermost giant planet.
The innermost dust ring of HD 100546 will likely evolve into a planetesimal belt and then potentially into a debris disc ring similar to that of HD 110058. If the dust trap strength were similar in both stars, the dust mass available in the dust ring of HD 110058 to form planetesimals might also be similar. The dust mass at the innermost dust ring of HD 100546 is ~241.7 M⊕ (Keyte et al. 2024). There are two different dust mass estimates for the debris disc around HD 110058. Below, we discuss the possible interpretations considering each dust mass estimate.
The secondary dust mass estimate for HD 110058 by Lieman-Sifry et al. (2016) is 0.003 M⊕. Assuming collisional equilibrium in the debris disc, a maximum size of 100 km for the planetesimals, and a standard Dohnanyi size distribution (Dohnanyi 1969) exponent of 3.5, we can indirectly infer the total planetesimal mass to be ~30 M⊕. Comparing the dust mass in the innermost ring of HD 100546 with the planetesimal mass in the debris disc of HD 110058, we can calculate the efficiency of planetesimal formation, ϵ ≈ 12%. Johansen et al. (2009) simulated the formation of planetesimals in a protoplanetary disc through streaming instability and self-gravity and found ϵ = 20%, with planetesimals of 100–200 km in size after five orbits. Further accretion becomes slow, thus slowing the growth of planetesimals. Although our results are an approximate estimate, it is interesting to point out the similarity in our results for the planetesimal formation efficiency (ϵ ≈ 12% from this observational work, ϵ = 20% from the Johansen et al. 2009 simulations).
A more recent dust mass estimate of HD 110058 by Hales et al. (2022) of  is an order of magnitude higher than 0.003 M⊕. The inferred planetesimal mass in HD 110058 will then be ~800 M⊕, which is higher than our considered initial dust mass for planetesimal formation (~241.7 M⊕, based on dust mass of inner dust ring of HD 100546). This might indicate that at least 800–241.7 ≈ 558 M⊕ is already in planetesimals in the inner dust ring of HD 100546.
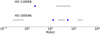 |
Fig. 8 Comparison of the dust disc positions (grey bars) between HD 100546 and HD 110058. The x-axis is in logarithmic scale. Blue dots represent confirmed and predicted giant planets. |
6 Conclusion
We estimated the stellar parameters and elemental abundances ofsix debris discs hosting A-type stars using high-resolution and high S/N spectra. The main goals were to identify any chemical peculiarities, or lack thereof, and investigate any links between disc accretion and the stellar composition. Below, we summarise our key results and conclusions:
The oxygen abundance in young stars (<20Myr) decreases with age until the debris disc stage and then it can begin to rise again (Fig. 4). Whether the downward trend of O abundance is related to the accumulation of H2O ice in dust traps or the formation of hydrated planetesimals via streaming instability, resulting in oxygen-poor accretion, remains an open question. The upward trend after the young debris disc stage is then related to rotational mixing at the stellar photosphere;
HD 21997, 49Ceti, HD 131835 and HD 138813 are chemically normal, while HD 110058 and HD 32297 show λ Boö- type peculiarities due to refractory depletion in their photospheres;
The low photospheric accretion contamination parameter (fph) across all stars in our sample suggests ongoing debris disc accretion cannot significantly contaminate their photosphere;
The chronic depletion of refractory elemental abundances in HD 110058 and HD 32297 could indicate earlier contamination by dust-poor accretion from a protoplanetary disc. These stars could form the ‘missing link’ between Herbig Ae/Be stars with dust-poor accretion and main-sequence λBoö-type field stars;
We estimated a lower limit on the past accretion rate of 9 × 10⁻⁸ M⊙/yr for HD 110058, which is needed to explain the refractory depleted abundances observed in this star. This rate is similar to other Herbig stars, but is five orders of magnitude higher than the current rate from the debris disc. This supports our hypothesis of previous accretion contamination of the stellar photosphere;
HD 110058 shows refractory depletion similar to the pro- toplanetary disc-hosting star HD 100546, indicating comparable dust trapping in their disc. Both stars, part of the same Sco-Cen sub-association, likely formed from the same material. HD 100546 has an accretion rate similar to the earlier accretion of HD 110058. The depletion levels and solid belt locations suggest HD 110058 could prove to be a more evolved version of HD 100546.
Extending our abundance analysis to a larger sample of young debris disc-hosting stars will strengthen our hypothesis of the evolution of refractory stellar abundances with age due to stellar mixing. This will also offer insights into the timescale of the mixing process. Additionally, further investigation is needed to confirm the observed downward trend in oxygen abundance for young stars with discs and to identify where it originates from.
Acknowledgements
AA, SB, CPF, LF, and MK gratefully acknowledge funding from the European Union’s Horizon Europe research and innovation programme under grant agreement No. 101079231 (EXOHOST) and from UK Research and Innovation (UKRI) under the UK government’s Horizon Europe funding guarantee (grant number 10051045). AA acknowledges support from the Estonian Research Council grant PRG 2159. This research has used the VizieR catalogue access tool, CDS, Strasbourg, France. We thank the anonymous referee whose comments improved the quality of our paper. We thank Denis Shulyak for providing access to LLMODELS. We thank Luke Kyte for providing the radial disc’s mid-plane temperature profile for HD 100546. We thank Heleri Ramler and Alexandra Lehmets for their useful comments on the paper draft.
Appendix A Additional plots
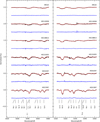 |
Fig. A.1 Spectral fitting of the debris disc host star sample around C lines (left panel) and an O line (right panel). The spectra are shifted vertically for better visualisation. Black represents the observed spectrum, red represents the best-fit synthetic spectrum, and blue represents the difference between the observed and synthetic spectrum. The spectra are sorted in increasing order of ν sin i value from bottom to top. |
Appendix B Additional data
Details about the spectra of the six stars used for this study.
Reference sample of protoplanetary disc-hosting stars for comparison.
References
- Acke, B., & Waelkens, C. 2004, A&A, 427, 1009 [NASA ADS] [CrossRef] [EDP Sciences] [Google Scholar]
- Ahmed, A., & Sigut, T. A. A. 2017, MNRAS, 471, 3398 [Google Scholar]
- Anders, F., Khalatyan, A., Queiroz, A. B. A., et al. 2022, A&A, 658, A91 [NASA ADS] [CrossRef] [EDP Sciences] [Google Scholar]
- Balona, L. A. 1994, MNRAS, 268, 119 [NASA ADS] [CrossRef] [Google Scholar]
- Bessell, M. S., Castelli, F., & Plez, B. 1998, A&A, 333, 231 [NASA ADS] [Google Scholar]
- Buder, S., Asplund, M., Duong, L., et al. 2018, MNRAS, 478, 4513 [Google Scholar]
- Castelli, F., & Kurucz, R. L. 2004, New Grids of ATLAS9 [Google Scholar]
- Model Atmospheres Castelli, F., Gratton, R. G., & Kurucz, R. L. 1997, A&A, 318, 841 [NASA ADS] [Google Scholar]
- Cataldi, G., Wu, Y., Brandeker, A., et al. 2020, ApJ, 892, 99 [NASA ADS] [CrossRef] [Google Scholar]
- Cataldi, G., Aikawa, Y., Iwasaki, K., et al. 2023, ApJ, 951, 111 [NASA ADS] [CrossRef] [Google Scholar]
- Dohnanyi, J. S. 1969, J. Geophys. Res., 74, 2531 [Google Scholar]
- Draper, Z. H., Matthews, B. C., Kennedy, G. M., et al. 2016, MNRAS, 456, 459 [Google Scholar]
- Draper, Z. H., Matthews, B., Venn, K., et al. 2018, ApJ, 857, 93 [Google Scholar]
- Fairlamb, J. R., Oudmaijer, R. D., Mendigutía, I., Ilee, J. D., & van den Ancker, M. E. 2015, MNRAS, 453, 976 [Google Scholar]
- Feldt, M., Olofsson, J., Boccaletti, A., et al. 2017, A&A, 601, A7 [NASA ADS] [CrossRef] [EDP Sciences] [Google Scholar]
- Folsom, C. P., Bagnulo, S., Wade, G. A., et al. 2012, MNRAS, 422, 2072 [NASA ADS] [CrossRef] [Google Scholar]
- Galicher, R., Marois, C., Macintosh, B., et al. 2016, A&A, 594, A63 [NASA ADS] [CrossRef] [EDP Sciences] [Google Scholar]
- Grant, S. L., Stapper, L. M., Hogerheijde, M. R., et al. 2023, AJ, 166, 147 [NASA ADS] [CrossRef] [Google Scholar]
- Gray, R. O. 1988, AJ, 95, 220 [NASA ADS] [CrossRef] [Google Scholar]
- Guzmán-Díaz, J., Montesinos, B., Mendigutía, I., et al. 2023, A&A, 671, A140 [NASA ADS] [CrossRef] [EDP Sciences] [Google Scholar]
- Hales, A. S., Gorti, U., Carpenter, J. M., Hughes, M., & Flaherty, K. 2019, ApJ, 878, 113 [NASA ADS] [CrossRef] [Google Scholar]
- Hales, A. S., Marino, S., Sheehan, P. D., et al. 2022, ApJ, 940, 161 [NASA ADS] [CrossRef] [Google Scholar]
- Herbig, G. H. 1960, ApJS, 4, 337 [Google Scholar]
- Higuchi, A. E., Sato, A., Tsukagoshi, T., et al. 2017, ApJ, 839, L14 [Google Scholar]
- Higuchi, A. E., Saigo, K., Kobayashi, H., et al. 2019, ApJ, 883, 180 [NASA ADS] [CrossRef] [Google Scholar]
- Higuchi, A. E., Kóspál, Á., Moór, A., Nomura, H., & Yamamoto, S. 2020, ApJ, 905, 122 [NASA ADS] [CrossRef] [Google Scholar]
- Hughes, A. M., Lieman-Sifry, J., Flaherty, K. M., et al. 2017, ApJ, 839, 86 [NASA ADS] [CrossRef] [Google Scholar]
- Jang-Condell, H., Chen, C. H., Mittal, T., et al. 2015, ApJ, 808, 167 [NASA ADS] [CrossRef] [Google Scholar]
- Jermyn, A. S., & Kama, M. 2018, MNRAS, 476, 4418 [Google Scholar]
- Johansen, A., Youdin, A., & Mac Low, M.-M. 2009, ApJ, 704, L75 [NASA ADS] [CrossRef] [Google Scholar]
- Kaiser, A. 2006, in Astronomical Society of the Pacific Conference Series, 349, Astrophysics of Variable Stars, eds. C. Aerts & C. Sterken, 257 [Google Scholar]
- Kama, M., Folsom, C. P., & Pinilla, P. 2015, A&A, 582, L10 [NASA ADS] [CrossRef] [EDP Sciences] [Google Scholar]
- Kama, M., Bruderer, S., van Dishoeck, E. F., et al. 2016, A&A, 592, A83 [NASA ADS] [CrossRef] [EDP Sciences] [Google Scholar]
- Kama, M., Shorttle, O., Jermyn, A. S., et al. 2019, ApJ, 885, 114 [Google Scholar]
- Kasper, M., Apai, D., Wagner, K., & Robberto, M. 2015, ApJ, 812, L33 [NASA ADS] [CrossRef] [Google Scholar]
- Keyte, L., Kama, M., Chuang, K.-J., et al. 2024, MNRAS, 528, 388 [NASA ADS] [CrossRef] [Google Scholar]
- Kilian, J. 1994, A&A, 282, 867 [NASA ADS] [Google Scholar]
- Kóspál, Á., Moór, A., Juhász, A., et al. 2013, ApJ, 776, 77 [Google Scholar]
- Kral, Q., Matrà, L., Wyatt, M. C., & Kennedy, G. M. 2017, MNRAS, 469, 521 [NASA ADS] [CrossRef] [Google Scholar]
- Kral, Q., Marino, S., Wyatt, M. C., Kama, M., & Matrà, L. 2019, MNRAS, 489, 3670 [Google Scholar]
- Kral, Q., Davoult, J., & Charnay, B. 2020a, Nat. Astron., 4, 769 [Google Scholar]
- Kral, Q., Matrà, L., Kennedy, G. M., Marino, S., & Wyatt, M. C. 2020b, MNRAS, 497, 2811 [NASA ADS] [CrossRef] [Google Scholar]
- Kral, Q., Huet, P., Bergez-Casalou, C., et al. 2024, A&A, 692, A70 [NASA ADS] [CrossRef] [EDP Sciences] [Google Scholar]
- Kunzli, M., North, P., Kurucz, R. L., & Nicolet, B. 1997, A&AS, 122, 51 [NASA ADS] [CrossRef] [EDP Sciences] [Google Scholar]
- Kupka, Piskunov, N., Ryabchikova, T. A., Stempels, H. C., & Weiss, W. W. 1999, Astron. Astrophys. Suppl. Ser., 138, 119 [NASA ADS] [CrossRef] [EDP Sciences] [Google Scholar]
- Kupka, F. G., Ryabchikova, T. A., Piskunov, N. E., Stempels, H. C., & Weiss, W. W. 2000, Open Astron., 9, 590 [Google Scholar]
- Kurucz, R. 1993, Robert Kurucz CD-ROM, 13 [Google Scholar]
- Landstreet, J. D. 1988, ApJ, 326, 967 [Google Scholar]
- Lieman-Sifry, J., Hughes, A. M., Carpenter, J. M., et al. 2016, ApJ, 828, 25 [NASA ADS] [CrossRef] [Google Scholar]
- MacGregor, M. A., Weinberger, A. J., Hughes, A. M., et al. 2018, ApJ, 869, 75 [NASA ADS] [CrossRef] [Google Scholar]
- Meeus, G., Waters, L. B. F. M., Bouwman, J., et al. 2001, A&A, 365, 476 [CrossRef] [EDP Sciences] [Google Scholar]
- Mermilliod, J. C., Mermilliod, M., & Hauck, B. 1997, A&AS, 124, 349 [NASA ADS] [CrossRef] [EDP Sciences] [Google Scholar]
- Meshkat, T., Mawet, D., Bryan, M. L., et al. 2017, AJ, 154, 245 [Google Scholar]
- Mittal, T., Chen, C. H., Jang-Condell, H., et al. 2015, ApJ, 798, 87 [Google Scholar]
- Montgomery, S. L., & Welsh, B. Y. 2012, PASP, 124, 1042 [CrossRef] [Google Scholar]
- Moon, T. T., & Dworetsky, M. M. 1985, MNRAS, 217, 305 [NASA ADS] [CrossRef] [Google Scholar]
- Moór, A., Juhász, A., Kóspál, Á., et al. 2013, ApJ, 777, L25 [CrossRef] [Google Scholar]
- Moór, A., Curé, M., Kóspál, Á., et al. 2017, ApJ, 849, 123 [Google Scholar]
- Morgan, W. W., Keenan, P. C., & Kellman, E. 1943, An atlas of stellar spectra with an outline of spectral classification [Google Scholar]
- Napiwotzki, R., Schoenberner, D., & Wenske, V. 1993, A&A, 268, 653 [Google Scholar]
- Nielsen, E. L., De Rosa, R. J., Macintosh, B., et al. 2019, AJ, 158, 13 [Google Scholar]
- Nieva, M. F., & Przybilla, N. 2012, A&A, 539, A143 [NASA ADS] [CrossRef] [EDP Sciences] [Google Scholar]
- Olofsson, J., Thébault, P., Kennedy, G. M., & Bayo, A. 2022, A&A, 664, A122 [NASA ADS] [CrossRef] [EDP Sciences] [Google Scholar]
- Pace, G., Recio-Blanco, A., Piotto, G., & Momany, Y. 2006, A&A, 452, 493 [NASA ADS] [CrossRef] [EDP Sciences] [Google Scholar]
- Pearce, T. D., Launhardt, R., Ostermann, R., et al. 2022, A&A, 659, A135 [NASA ADS] [CrossRef] [EDP Sciences] [Google Scholar]
- Pinilla, P., Benisty, M., & Birnstiel, T. 2012, A&A, 545, A81 [NASA ADS] [CrossRef] [EDP Sciences] [Google Scholar]
- Pinilla, P., Birnstiel, T., & Walsh, C. 2015, A&A, 580, A105 [NASA ADS] [CrossRef] [EDP Sciences] [Google Scholar]
- Piskunov, N. E., Kupka, F., Ryabchikova, T. A., Weiss, W. W., & Jeffery, C. S. 1995, A&AS, 112, 525 [Google Scholar]
- Redfield, S. 2007, ApJ, 656, L97 [NASA ADS] [CrossRef] [Google Scholar]
- Rhee, J. H., Song, I., Zuckerman, B., & McElwain, M. 2007, ApJ, 660, 1556 [Google Scholar]
- Ribas, I., Jordi, C., Torra, J., & Gimenez, A. 1997, A&A, 327, 207 [NASA ADS] [Google Scholar]
- Rice, W. K. M., Armitage, P. J., Wood, K., & Lodato, G. 2006, MNRAS, 373, 1619 [Google Scholar]
- Roberge, A., Welsh, B. Y., Kamp, I., Weinberger, A. J., & Grady, C. A. 2014, ApJ, 796, L11 [NASA ADS] [CrossRef] [Google Scholar]
- Róz˙an’ski, T., Niemczura, E., Lemiesz, J., Posiłek, N., & Różański, P. 2022, SUP- PNet: Spectrum normalization neural network, Astrophysics Source Code Library [record ascl:2202.004] [Google Scholar]
- Ryabchikova, T. A., Piskunov, N. E., Kupka, F., & Weiss, W. W. 1997, Open Astron., 6, 244 [Google Scholar]
- Ryabchikova, T., Piskunov, N., Kurucz, R. L., et al. 2015, Phys. Scr., 90, 054005 [Google Scholar]
- Saffe, C., Miquelarena, P., Alacoria, J., et al. 2021, A&A, 647, A49 [NASA ADS] [CrossRef] [EDP Sciences] [Google Scholar]
- Schlafly, E. F., & Finkbeiner, D. P. 2011, ApJ, 737, 103 [Google Scholar]
- Schlegel, D. J., Finkbeiner, D. P., & Davis, M. 1998, ApJ, 500, 525 [Google Scholar]
- Schneider, G., Grady, C. A., Hines, D. C., et al. 2014, AJ, 148, 59 [NASA ADS] [CrossRef] [Google Scholar]
- Shulyak, D., Tsymbal, V., Ryabchikova, T., Stütz, C., & Weiss, W. W. 2004, A&A, 428, 993 [NASA ADS] [CrossRef] [EDP Sciences] [Google Scholar]
- Simpson, J. D., Martell, S. L., Da Costa, G., et al. 2019, MNRAS, 482, 5302 [Google Scholar]
- Stasevic, S., Milli, J., Mazoyer, J., et al. 2023, A&A, 678, A8 [NASA ADS] [CrossRef] [EDP Sciences] [Google Scholar]
- Tanrıverdi, T. 2013, New Astron., 25, 50 [Google Scholar]
- Tetzlaff, N., Neuhäuser, R., & Hohle, M. M. 2011, MNRAS, 410, 190 [Google Scholar]
- Turcotte, S. 2002, ApJ, 573, L129 [Google Scholar]
- Turon, C., Creze, M., Egret, D., et al. 1993, Bull. Inform. Centre Donnees Stellaires, 43, 5 [Google Scholar]
- Ujjwal, K., Kartha, S. S., Mathew, B., Manoj, P., & Narang, M. 2020, AJ, 159, 166 [NASA ADS] [CrossRef] [Google Scholar]
- Viana Almeida, P., Santos, N. C., Melo, C., et al. 2009, A&A, 501, 965 [NASA ADS] [CrossRef] [EDP Sciences] [Google Scholar]
- Wade, G. A., Bagnulo, S., Kochukhov, O., et al. 2001, A&A, 374, 265 [NASA ADS] [CrossRef] [EDP Sciences] [Google Scholar]
- Waters, L. B. F. M., & Waelkens, C. 1998, ARA&A, 36, 233 [NASA ADS] [CrossRef] [Google Scholar]
- Youdin, A. N., & Goodman, J. 2005, ApJ, 620, 459 [Google Scholar]
- Zuckerman, B., & Song, I. 2012, ApJ, 758, 77 [Google Scholar]
All Tables
Stellar parameters and elemental abundances for our sample of six debris disc-hosting stars.
All Figures
|
Fig. 1 Observed-synthetic colours for different photometric systems. Better Teff and log g estimates produce a difference closer to zero. The top-left corner includes a typical uncertainty in observed colours. The colour difference for HD 138813 is based on E(B - V) = 0.04. |
| In the text | |
|
Fig. 2 Spectral fitting of the debris disc host star sample. The spectra are shifted vertically for better visualisation. Black represents the observed spectrum, red represents the best-fit synthetic spectrum, and blue represents the difference between the observed and synthetic spectrum. The spectra are sorted in increasing order of ν sin i value from bottom to top. |
| In the text | |
|
Fig. 3 Comparing the elemental abundances of debris disc host stars (this work) with that of similar stars in the Sco-Cen association (see Table 5) as reference. The yellow and grey circles represent individual Sco-Cen association members. The stars represent the median abundance of the Sco-Cen association members. The x-axis is in increasing order of elemental condensation temperature. The condensation temperature also increases from the top to the bottom panel. The volatile abundances (C, N, O) show no depletion for all stars. The refractory abundances are depleted in HD 110058 and HD 32297, likely due to dust-poor material accretion from their early protoplanetary discs. |
| In the text | |
|
Fig. 4 Volatile abundance vs age plots. Top panel: C vs age plot, Bottom panel: O vs age plot. GI and GII mean group I and group II protoplanetary disc-hosting stars, respectively. DD stands for debris disc-hosting stars. |
| In the text | |
|
Fig. 5 Fe abundance vs age plot. Red curve and blue curve represents evolution of stellar Fe abundance for stars with group I and group II protoplanetary discs, respectively. DD S21: Young debris disc-hosting stars HD 169142, HD 120326, β Pic, HR 8799, and HD 95086 from Saffe et al. (2021). The abbreviations are described in Fig. 4. |
| In the text | |
|
Fig. 6 Range of |
| In the text | |
|
Fig. 7 Difference between stellar abundances of HD 110058 and HD 100546 in increasing order of condensation temperature. The abundances are on a logarithmic scale. The highlighted regions in red (top) and blue (bottom) represent the radial disc’s mid-plane dust temperatures for HD 100546 and HD 110058, respectively. For HD 100546, we used the mid-planet dust radial temperature profile from Keyte et al. (2024). For HD 110058, we used the Stefan Boltzmann law and stellar luminosity to estimate the radial temperature profile for the debris disc and giant planet. The vertical lines indicate the temperatures at the position of the planets (confirmed or predicted) in the radial disc temperature profiles around both stars. |
| In the text | |
|
Fig. 8 Comparison of the dust disc positions (grey bars) between HD 100546 and HD 110058. The x-axis is in logarithmic scale. Blue dots represent confirmed and predicted giant planets. |
| In the text | |
|
Fig. A.1 Spectral fitting of the debris disc host star sample around C lines (left panel) and an O line (right panel). The spectra are shifted vertically for better visualisation. Black represents the observed spectrum, red represents the best-fit synthetic spectrum, and blue represents the difference between the observed and synthetic spectrum. The spectra are sorted in increasing order of ν sin i value from bottom to top. |
| In the text | |
Current usage metrics show cumulative count of Article Views (full-text article views including HTML views, PDF and ePub downloads, according to the available data) and Abstracts Views on Vision4Press platform.
Data correspond to usage on the plateform after 2015. The current usage metrics is available 48-96 hours after online publication and is updated daily on week days.
Initial download of the metrics may take a while.