Fig. 6
Download original image
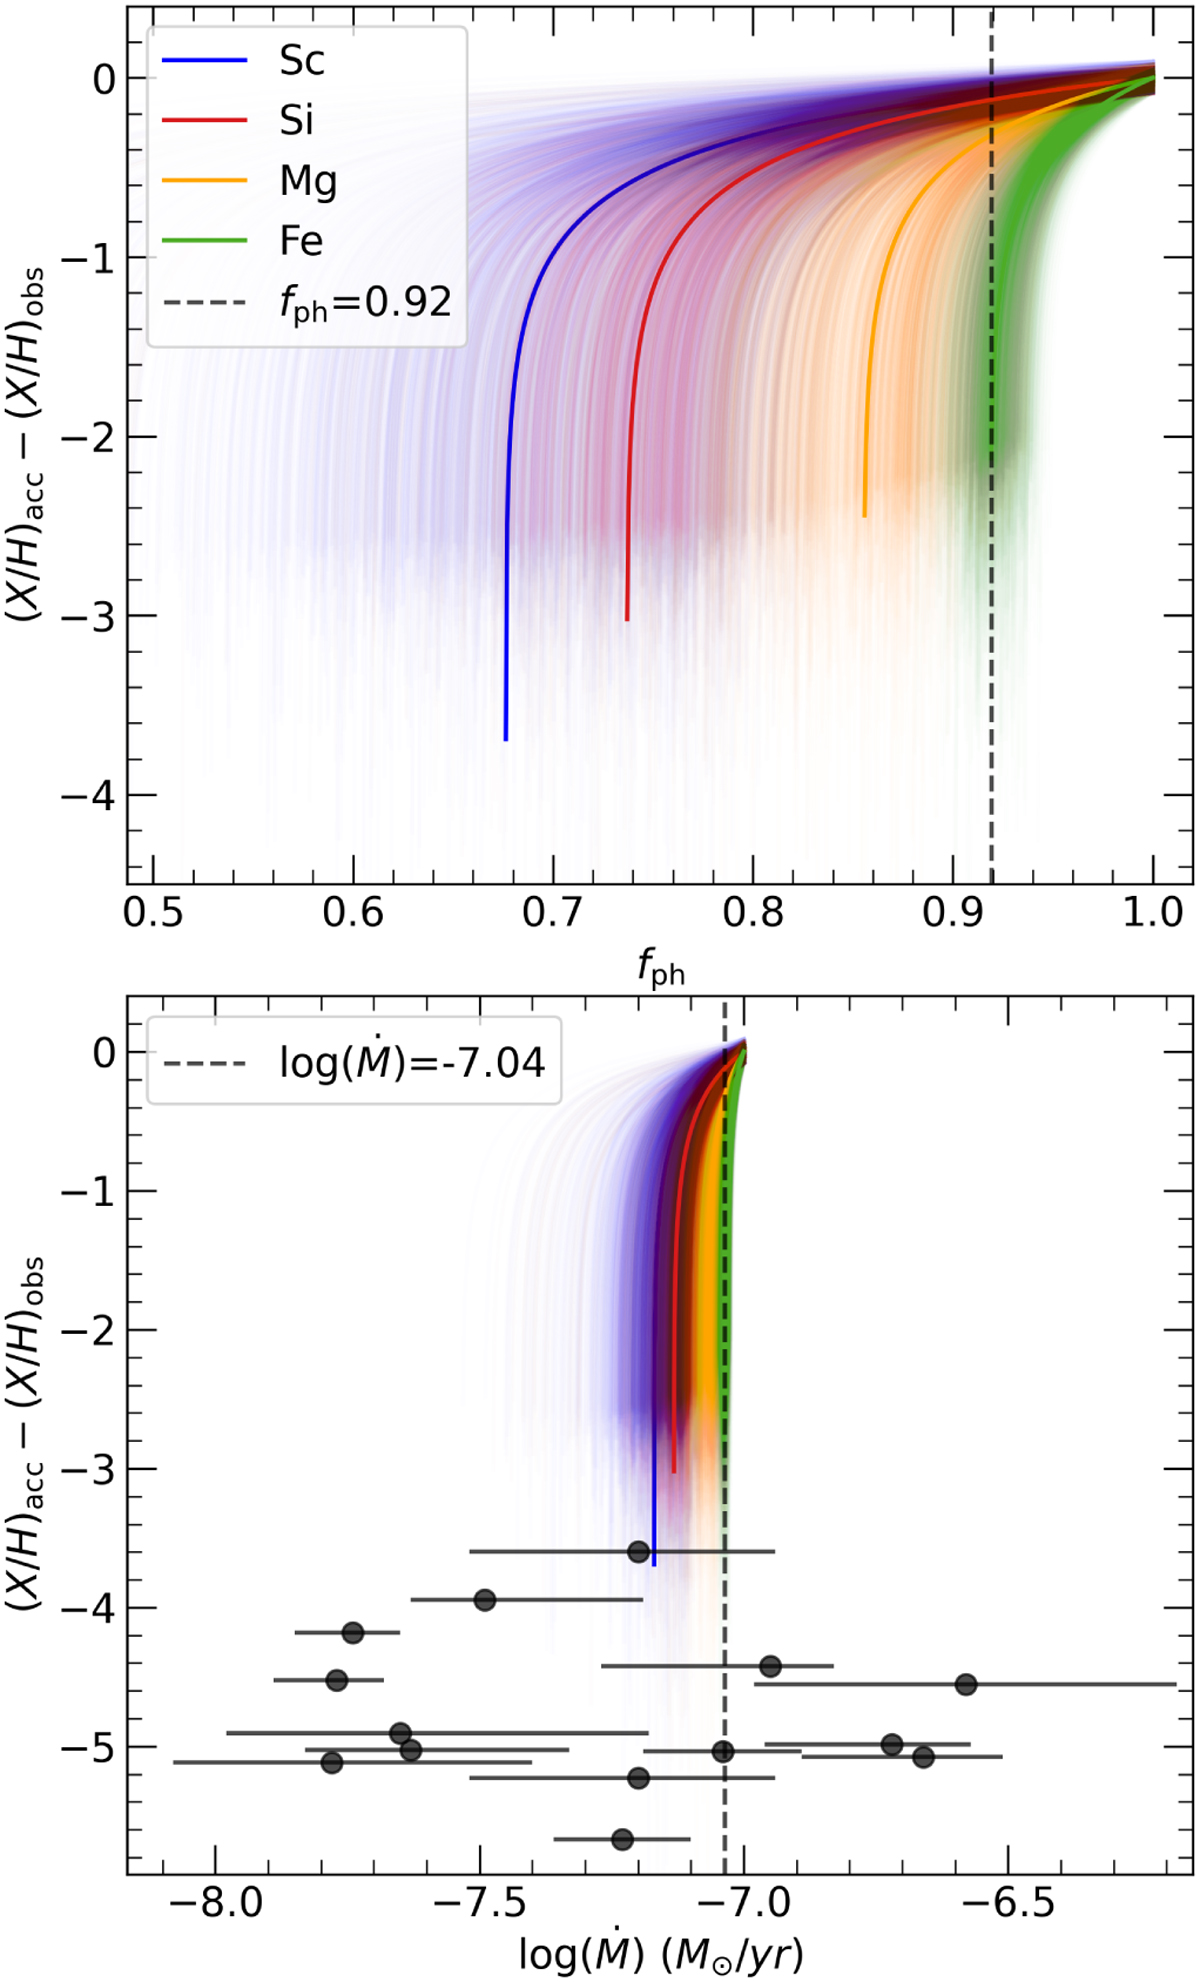
Range of ![]() -
- ![]() and fph (top panel) or Ṁacc (bottom panel) satisfying Eq. (4) for different elements. The y-axis for both panels is represented as
and fph (top panel) or Ṁacc (bottom panel) satisfying Eq. (4) for different elements. The y-axis for both panels is represented as ![]() -
- ![]() to bring all the elements to the same scale. The y-axis is logarithmic. The thin curves for each element represent range calculations considering uncertainty in
to bring all the elements to the same scale. The y-axis is logarithmic. The thin curves for each element represent range calculations considering uncertainty in ![]() from our measurements and the dark curves represent the range for the average
from our measurements and the dark curves represent the range for the average ![]() . The dashed line represents the highest lower limit on the fph (top panel) and Ṁacc (bottom panel). The black dots in the bottom panel represent Ṁacc and
. The dashed line represents the highest lower limit on the fph (top panel) and Ṁacc (bottom panel). The black dots in the bottom panel represent Ṁacc and ![]() of Herbig stars from literature work summarised in Kama et al. (2019).
of Herbig stars from literature work summarised in Kama et al. (2019).
Current usage metrics show cumulative count of Article Views (full-text article views including HTML views, PDF and ePub downloads, according to the available data) and Abstracts Views on Vision4Press platform.
Data correspond to usage on the plateform after 2015. The current usage metrics is available 48-96 hours after online publication and is updated daily on week days.
Initial download of the metrics may take a while.