Fig. 2
Download original image
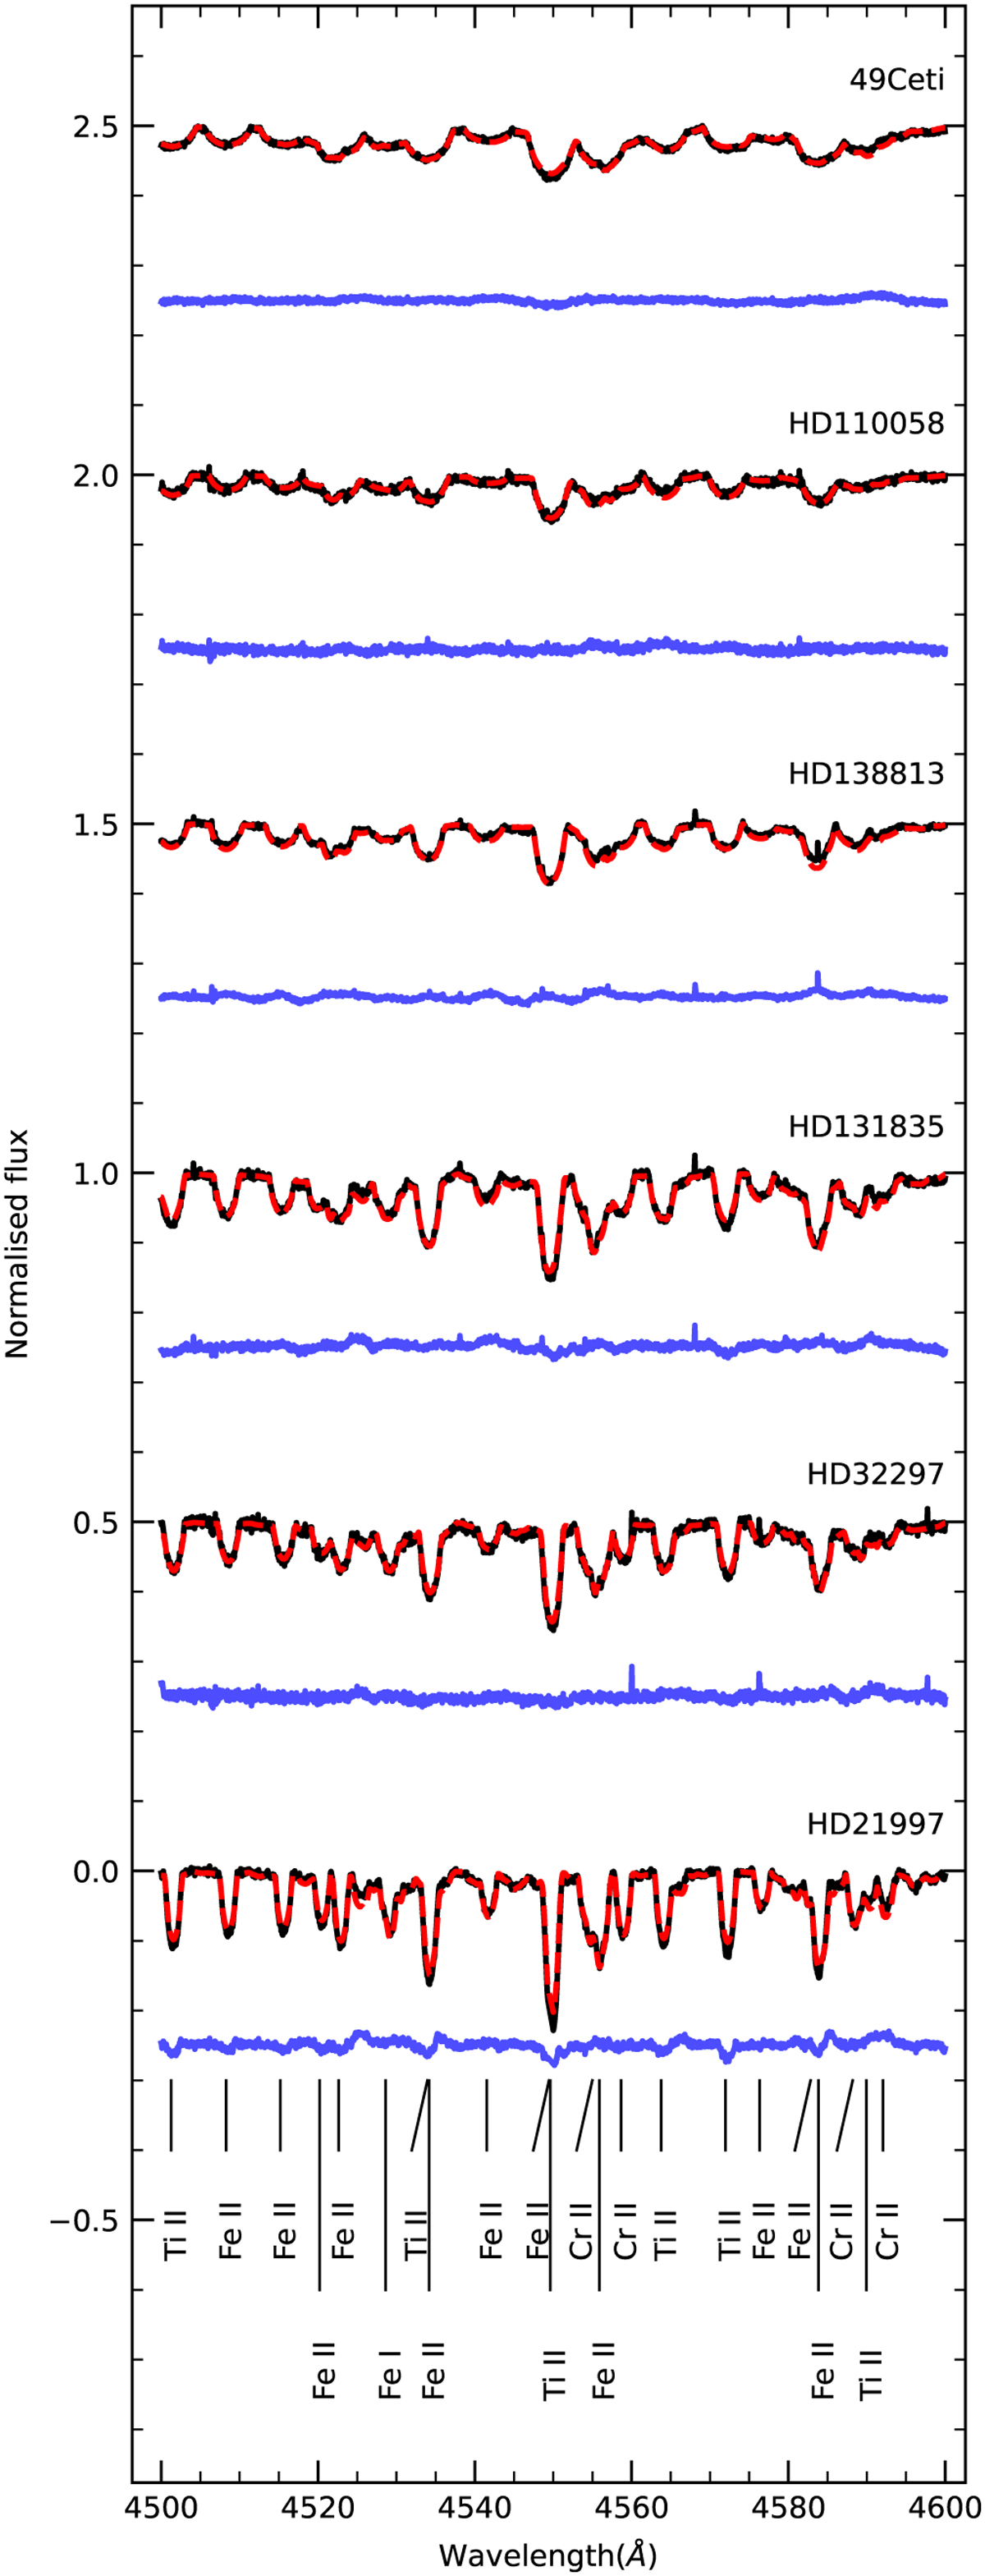
Spectral fitting of the debris disc host star sample. The spectra are shifted vertically for better visualisation. Black represents the observed spectrum, red represents the best-fit synthetic spectrum, and blue represents the difference between the observed and synthetic spectrum. The spectra are sorted in increasing order of ν sin i value from bottom to top.
Current usage metrics show cumulative count of Article Views (full-text article views including HTML views, PDF and ePub downloads, according to the available data) and Abstracts Views on Vision4Press platform.
Data correspond to usage on the plateform after 2015. The current usage metrics is available 48-96 hours after online publication and is updated daily on week days.
Initial download of the metrics may take a while.