Fig. 4.
Download original image
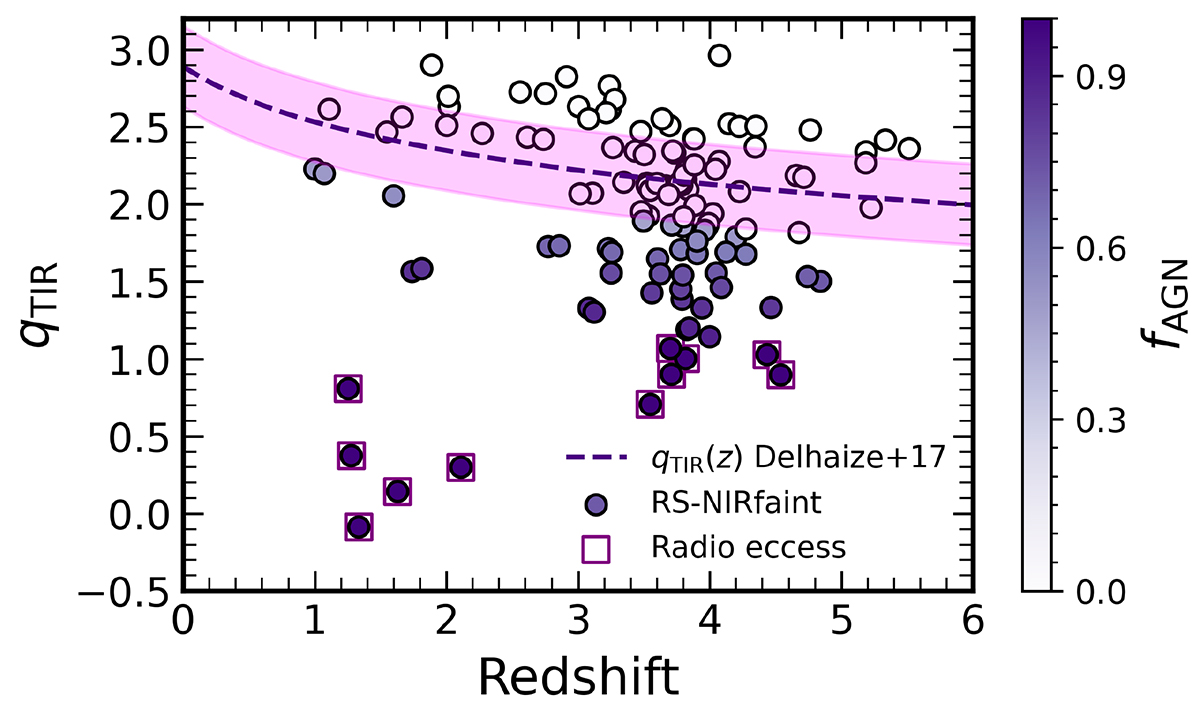
Our estimation of the qTIR parameter for our galaxies as a function of the redshift. The dashed line reports the qTIR(z) relation by Delhaize et al. (2017), with the shaded area indicating the intrinsic scatter of the relation. Our galaxies are color-coded for their AGN fraction, measuring the contribution of nuclear activity to the radio luminosity. Galaxies classified as “radio-excess” (i.e., with fAGN > 0.9) are surrounded by a red square and removed from the sample.
Current usage metrics show cumulative count of Article Views (full-text article views including HTML views, PDF and ePub downloads, according to the available data) and Abstracts Views on Vision4Press platform.
Data correspond to usage on the plateform after 2015. The current usage metrics is available 48-96 hours after online publication and is updated daily on week days.
Initial download of the metrics may take a while.