Fig. 4.
Download original image
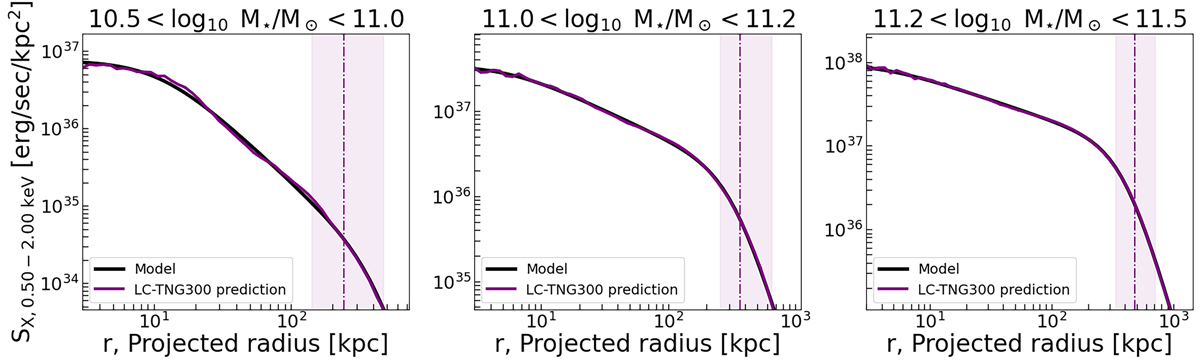
Mean X-ray surface brightness profiles in the stellar mass bins: M★ = 1010.5−11 M⊙, corresponding to MW-like galaxies (left), M★ = 1011−11.25 M⊙ (centre), and M★ = 1011.25−11.5 M⊙ (right). The vertical dashed line is the mean R500c at 242.75 kpc (left), 369.01 kpc (centre), and 484.52 kpc (right) of the respective galaxy stellar mass bin with the shaded area corresponding to the minimum and maximum values. The black line is the analytical model, shown in Eq. (7), fit to the LC-TNG300 mean X-ray surface brightness profiles. The best-fitting parameters for the model are given in Table 3. We find decreasing values for the slope, β, with increasing stellar mass bins.
Current usage metrics show cumulative count of Article Views (full-text article views including HTML views, PDF and ePub downloads, according to the available data) and Abstracts Views on Vision4Press platform.
Data correspond to usage on the plateform after 2015. The current usage metrics is available 48-96 hours after online publication and is updated daily on week days.
Initial download of the metrics may take a while.