Fig. 6
Download original image
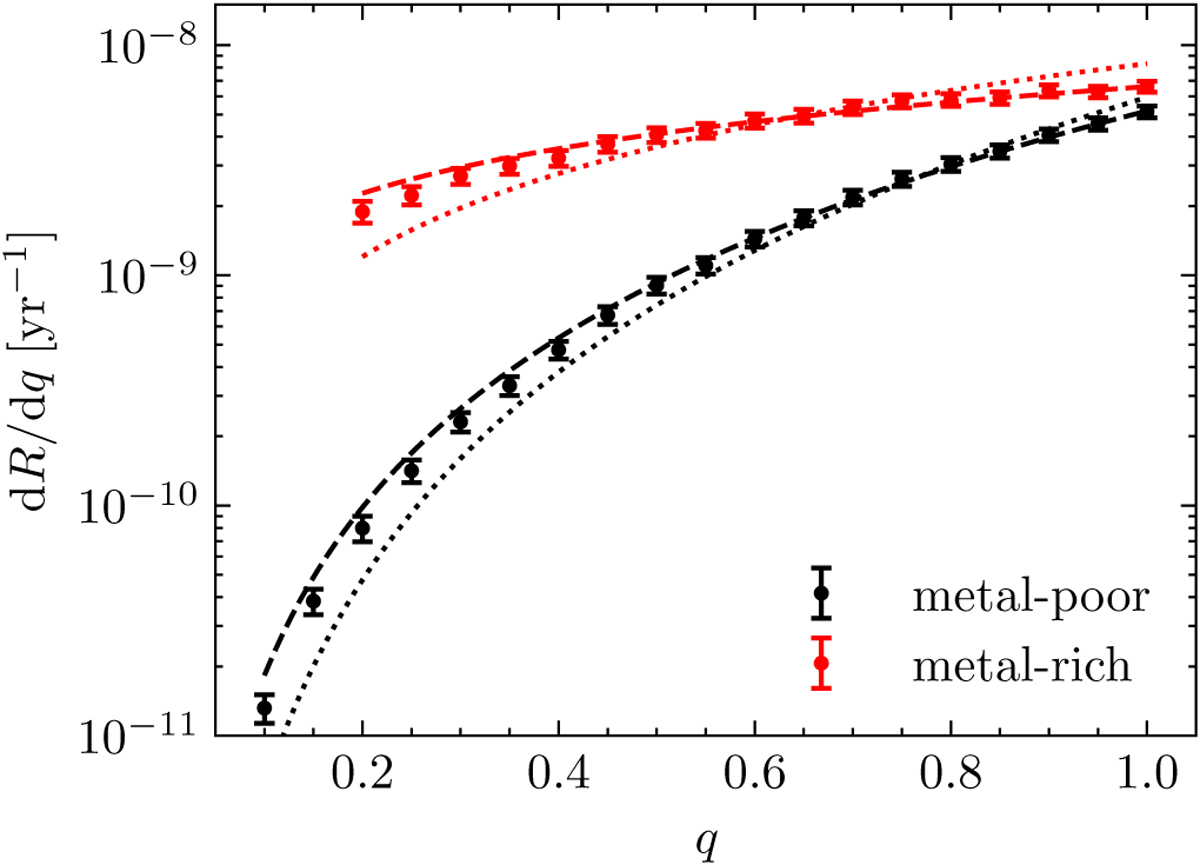
Mass-ratio distribution of in-cluster mergers, for a metalpoor (black) and metal-rich (red) clusters with Mcl = 2 × 10⁵ m⊙ and rh = 3 pc. The dashed lines represent the theoretical slopes given in Equation (30) and the dotted lines represent p2(q2). Both the dashed and dotted lines have been normalised to the same normalisation constant as the data points.
Current usage metrics show cumulative count of Article Views (full-text article views including HTML views, PDF and ePub downloads, according to the available data) and Abstracts Views on Vision4Press platform.
Data correspond to usage on the plateform after 2015. The current usage metrics is available 48-96 hours after online publication and is updated daily on week days.
Initial download of the metrics may take a while.