Open Access
Fig. 5
Download original image
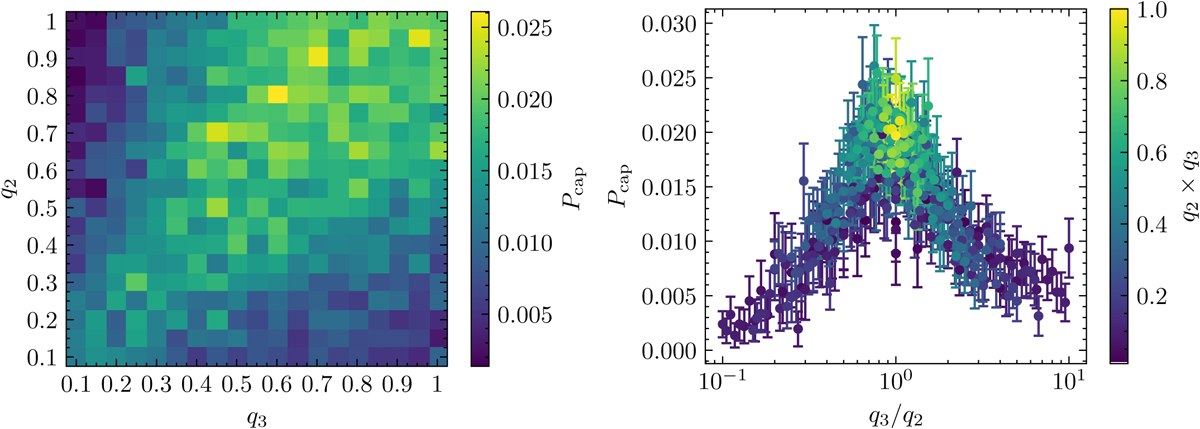
Left: Pcap as a function of q2 and q3. Right: Pcap as a function of q2/q3. For that, we used m1 = 45 m⊙, a = aGW, and assumed a metal-poor cluster with Mcl = 5 × 10⁵ m⊙ and rh = 1 pc. The error bars are computed via ![]() , with Nbin the number of resonant events in the bin, and Ncap the number of GW captures among them.
, with Nbin the number of resonant events in the bin, and Ncap the number of GW captures among them.
Current usage metrics show cumulative count of Article Views (full-text article views including HTML views, PDF and ePub downloads, according to the available data) and Abstracts Views on Vision4Press platform.
Data correspond to usage on the plateform after 2015. The current usage metrics is available 48-96 hours after online publication and is updated daily on week days.
Initial download of the metrics may take a while.