Fig. 4
Download original image
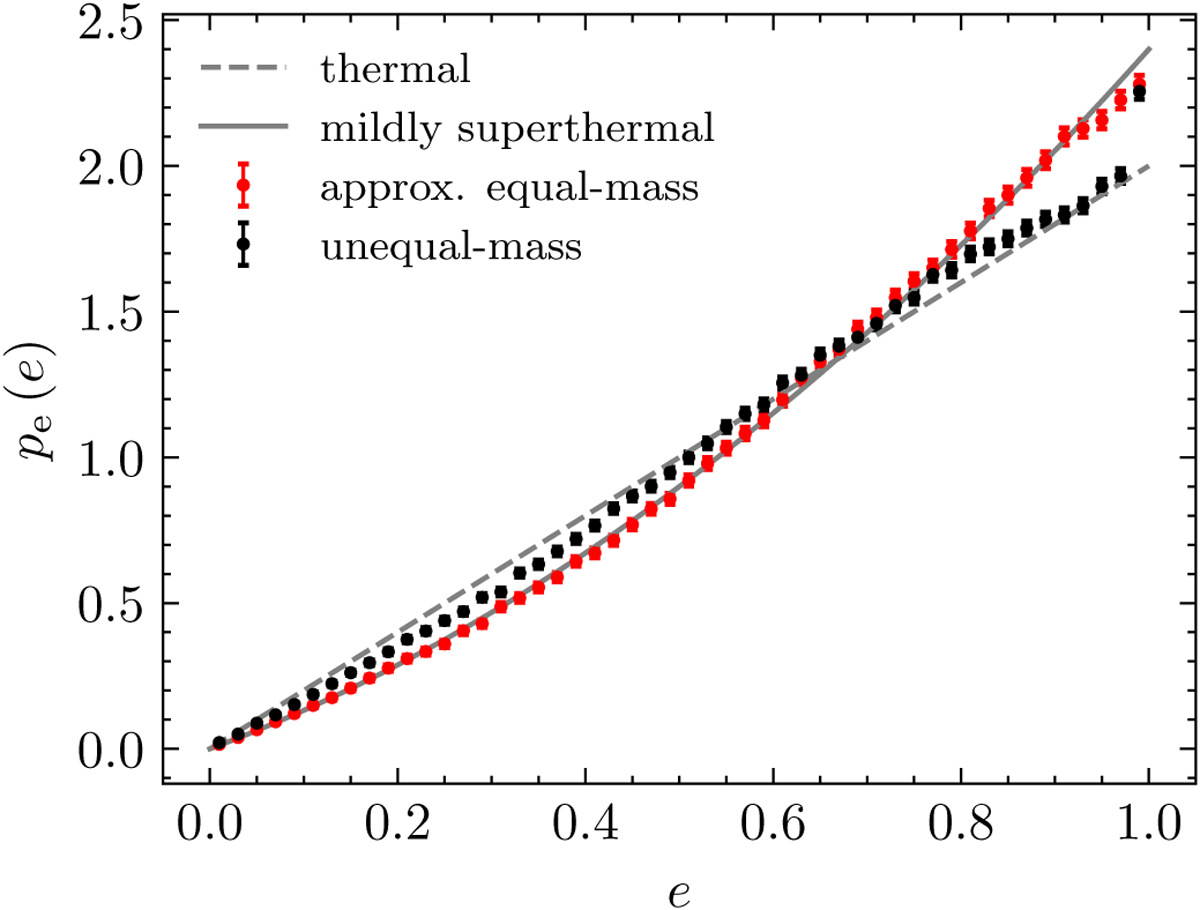
Eccentricity distribution after a democratic resonance. For the approximate equal mass case, the data points were selected by imposing the condition q2, q3 ∈ [0.5,1]. For the unequal-mass case, the data points were selected by imposing the condition q2 ∈ [0.1,0.4] or q3 ∈ [0.1,0.4]. The dashed lines represent the thermal distribution, and the solid line represents the mildly superthermal distribution.
Current usage metrics show cumulative count of Article Views (full-text article views including HTML views, PDF and ePub downloads, according to the available data) and Abstracts Views on Vision4Press platform.
Data correspond to usage on the plateform after 2015. The current usage metrics is available 48-96 hours after online publication and is updated daily on week days.
Initial download of the metrics may take a while.