Fig. 6
Download original image
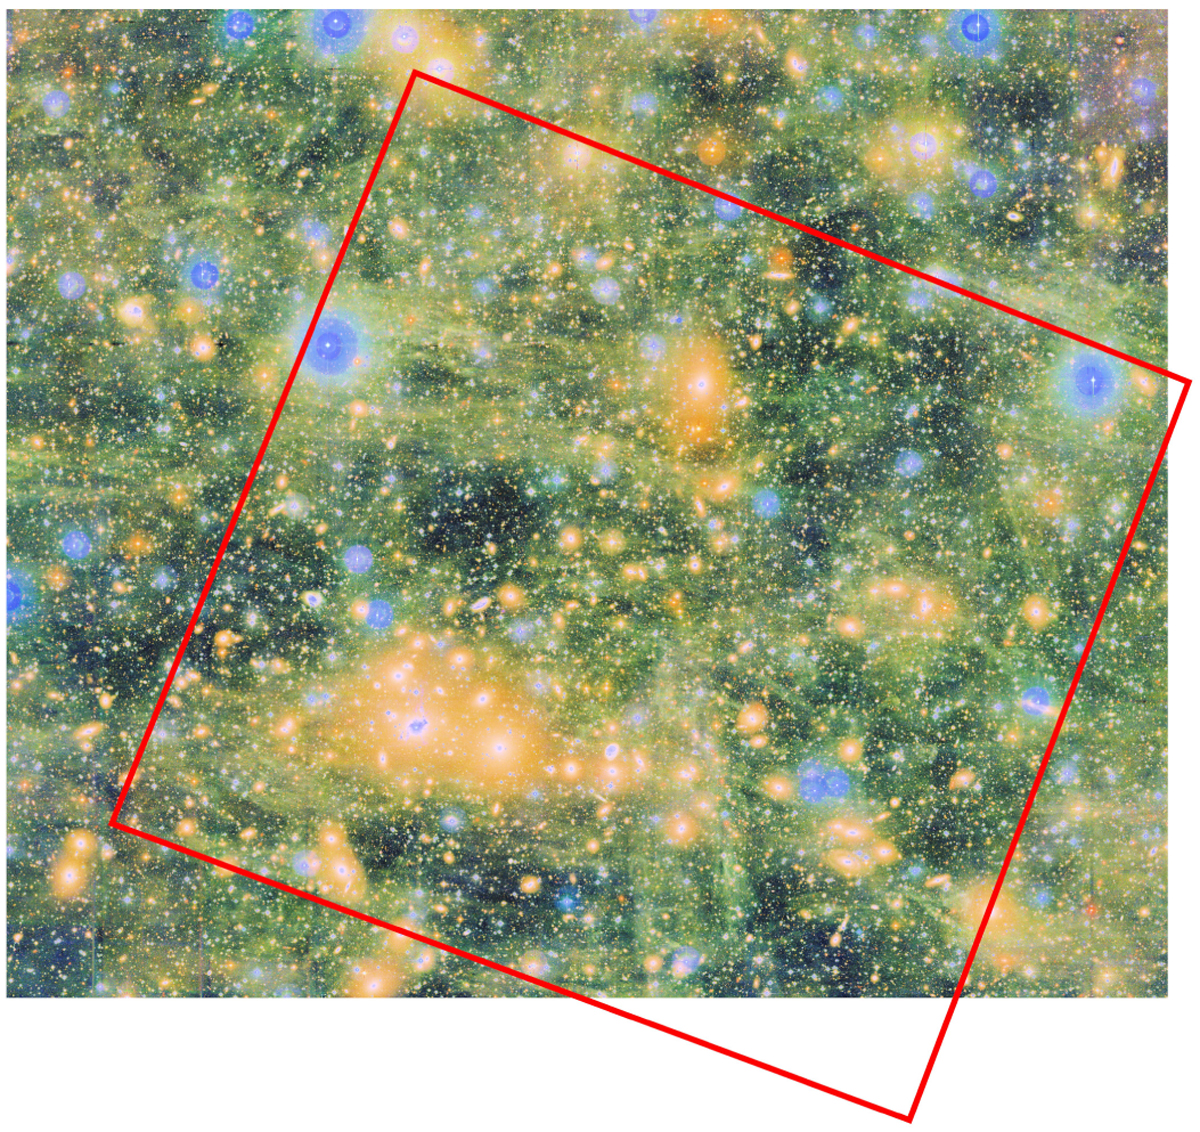
Euclid Perseus area, marked in red and covering 0.7 deg2, shown against the broader coverage of the CFHT-MegaCam observations, which extend over 1.2 deg2. North is up, east is left. This high-contrast colour image is a composite RGB picture created from the MegaCam r, g, and u bands. The three brightest galaxies (NGC 1265, NGC 1272, and NGC 1275) can be spotted as large yellow blobs within the red footprint in the upper side and lower left corner of the Euclid FoV, with coordinates given in Fig. 24. The Galactic cirrus, which peaks in brightness in the g band, highlights the extent of contamination in this area, with an average E(B − V) of 0.156. While significantly fainter in the r band, the Galactic cirrus still impacts the VIS IE band, thereby limiting the low-surface brightness performance across the Euclid FoV.
Current usage metrics show cumulative count of Article Views (full-text article views including HTML views, PDF and ePub downloads, according to the available data) and Abstracts Views on Vision4Press platform.
Data correspond to usage on the plateform after 2015. The current usage metrics is available 48-96 hours after online publication and is updated daily on week days.
Initial download of the metrics may take a while.