Fig. 21
Download original image
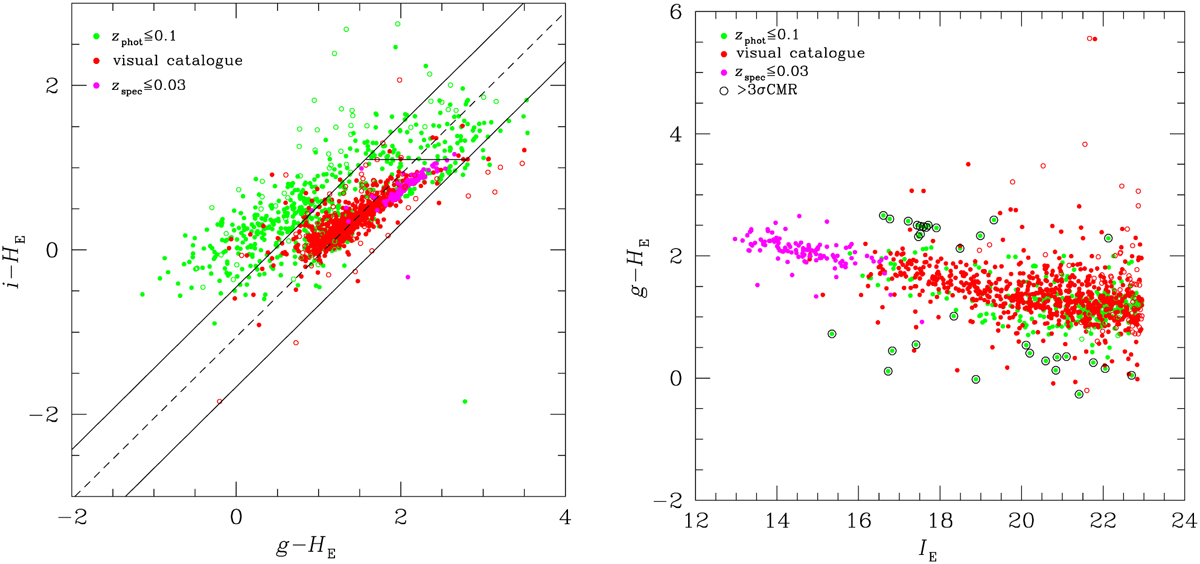
Left: colour–colour diagram of i − HE versus g − HE for all sources in the full SourceExtractor catalogue. The points represent the objects with IE ≤ 22.96 identified as galaxies in Fig. 20 with zphot ≲ 0.1 (green dots), and optically identified (red dots) or spectroscopically confirmed (magenta dots) cluster members (zspec ≲ 0.03). Filled dots are for galaxies with uncertainty in the colour larger than 0.1 mag. The black dashed line shows the bisector fit to the data, (i − HE) = (0.99 ± 0.02) × (g − HE) − (1.06 ± 0.01), σ = 0.26, for galaxies with a colour uncertainty σcol ≲ 0.1, while the solid lines delimit the region within the 3 σ dispersion of the relation, where 99.7% of the spectroscopically and visually identified members are located. The black solid horizontal line shows the upper limit in colour observed in the spectroscopically confirmed cluster members (i − HE < 1.1). Right: colour–magnitude relation of i − HE versus IE for the same sample of galaxies but limited to those objects identified as potential cluster members in the i − HE versus g − HE colour–colour diagram (left panel). Galaxies are identified using the same symbols, with the exception of green dots within black circles, which are systems lying > 3 σ from the mean colour–magnitude relation, where 99.7% of the spectroscopically and visually identified cluster members are located. Those located below the colour–magnitude relation are possible star-forming cluster members.
Current usage metrics show cumulative count of Article Views (full-text article views including HTML views, PDF and ePub downloads, according to the available data) and Abstracts Views on Vision4Press platform.
Data correspond to usage on the plateform after 2015. The current usage metrics is available 48-96 hours after online publication and is updated daily on week days.
Initial download of the metrics may take a while.