Fig. 20
Download original image
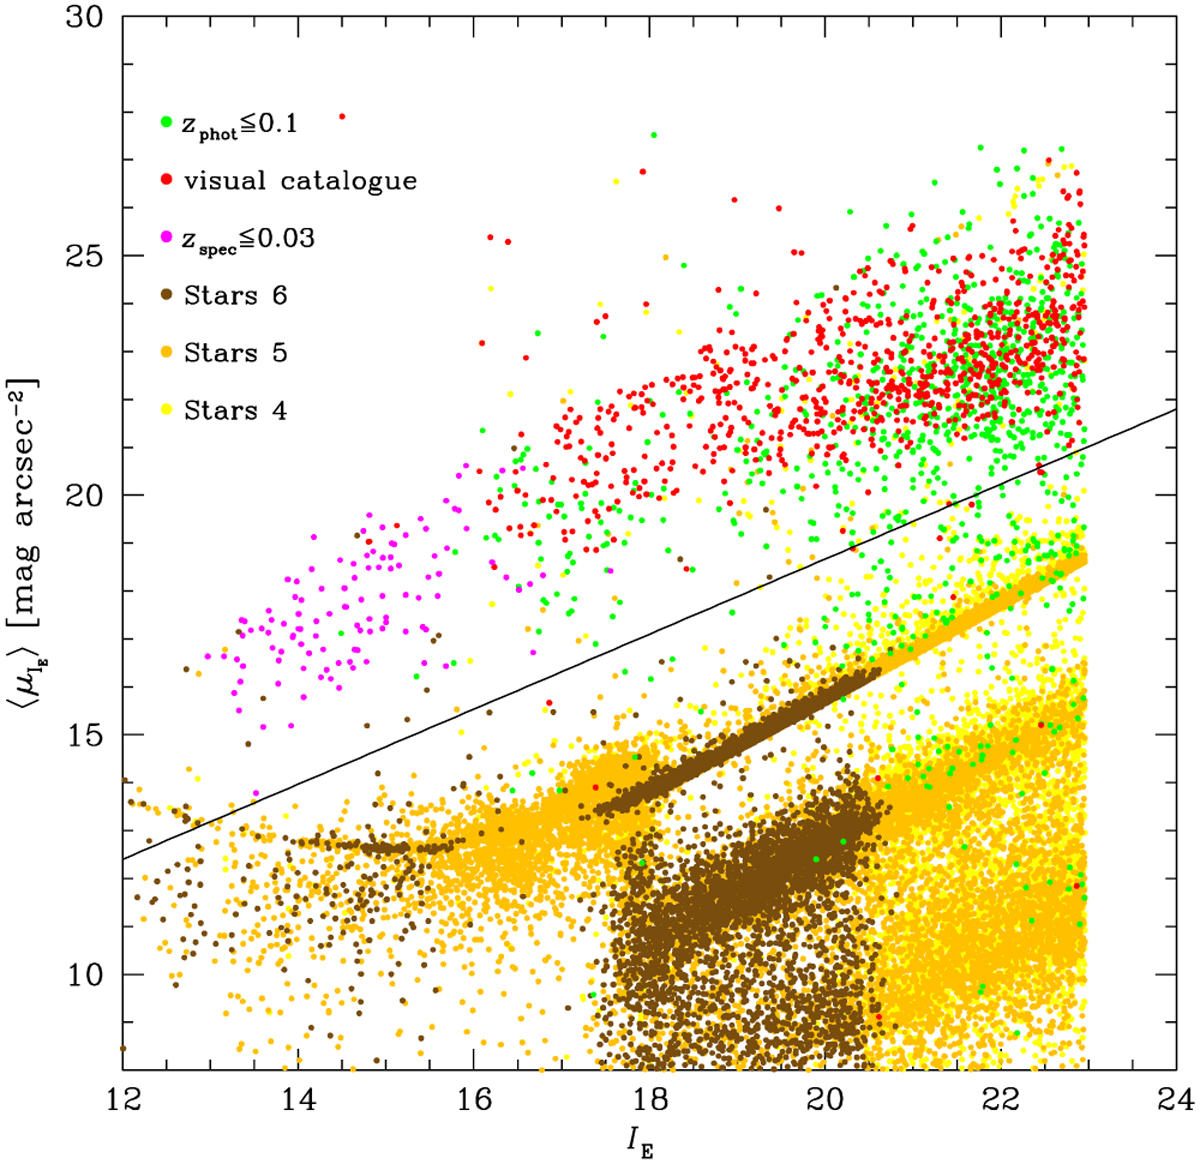
Relation between the mean versus model effective surface brightness and the total magnitude for all sources in the full SourceExtractor catalogue with IE ≤ 22.96. Brown, orange, and yellow dots are for targets classified as stars consistently by six, five, and four independent criteria, respectively. Green dots are for galaxies with photometric redshifts from Phosphoros zphot ≤ 0.1, red dots for optically identified cluster members, and magenta dots for spectroscopically confirmed cluster members (zspec ≲ 0.03). The black solid line (⟨μIE⟩ = 0.783 IE + 3 mag arcsec−2) delimits the region where most (13/899, 1.4%) of the spectroscopically and visually identified members are located.
Current usage metrics show cumulative count of Article Views (full-text article views including HTML views, PDF and ePub downloads, according to the available data) and Abstracts Views on Vision4Press platform.
Data correspond to usage on the plateform after 2015. The current usage metrics is available 48-96 hours after online publication and is updated daily on week days.
Initial download of the metrics may take a while.