Fig. 19
Download original image
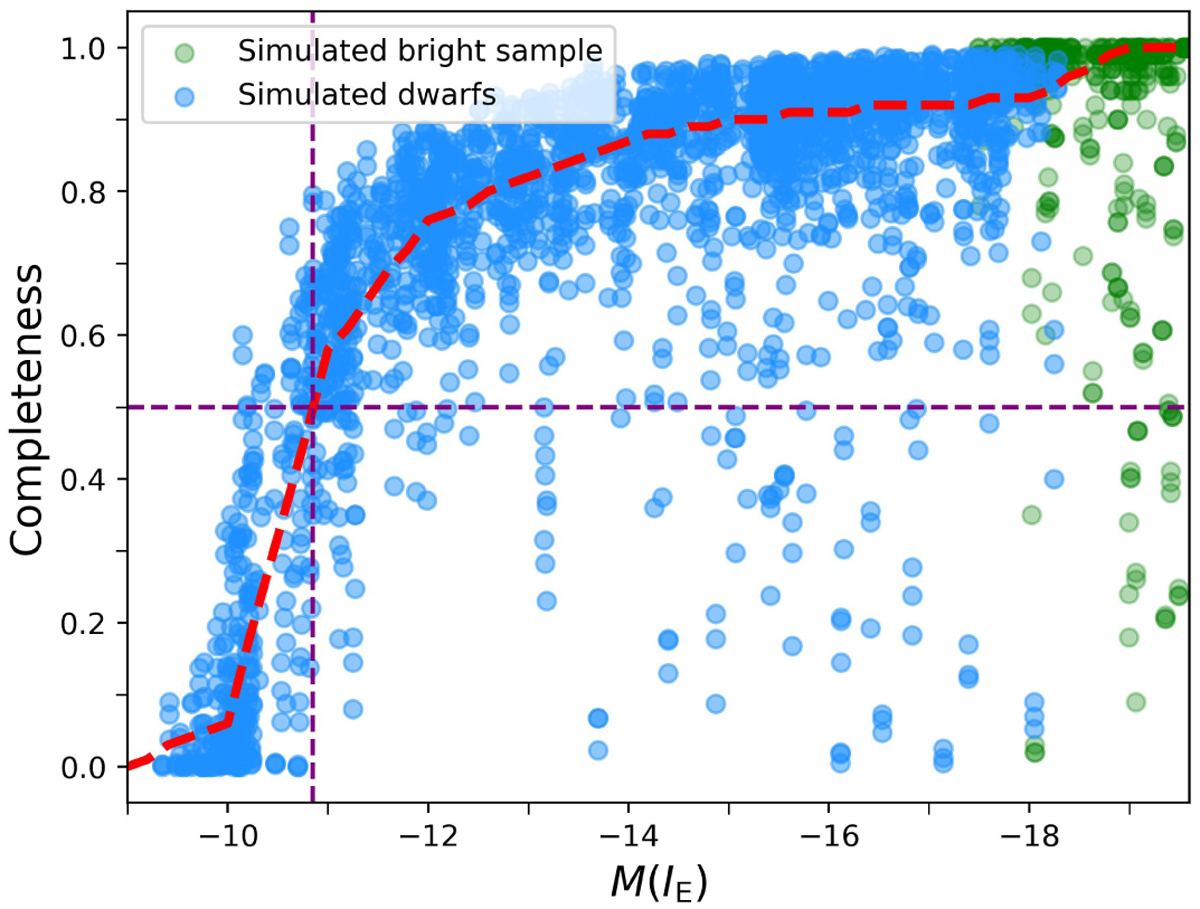
Completeness estimates. The completeness of the Perseus dwarf galaxies is depicted in blue, based on 980 400 individual injections across three distinct Perseus regions, each containing 400 samples from each of the 817 simulated galaxies, resulting in 2451 completeness measurements shown on this plot. The dashed red line (a polynomial fit based on the median values) shows that completeness begins to decline at M(IE) = −12, dropping to 50% (horizontal dashed line) at −10.9. The green data points illustrate that even the faintest of our bright galaxy samples achieve 96% completeness when simulated similarly to the dwarfs, with completeness approaching 100% at M(IE) = −19. For brighter and larger galaxies, the testing method used here is not ideally suited, leading to an apparent drop in completeness (green dots on the right). However, our catalogue achieves 100% completeness for all bright galaxies.
Current usage metrics show cumulative count of Article Views (full-text article views including HTML views, PDF and ePub downloads, according to the available data) and Abstracts Views on Vision4Press platform.
Data correspond to usage on the plateform after 2015. The current usage metrics is available 48-96 hours after online publication and is updated daily on week days.
Initial download of the metrics may take a while.