Fig. 17
Download original image
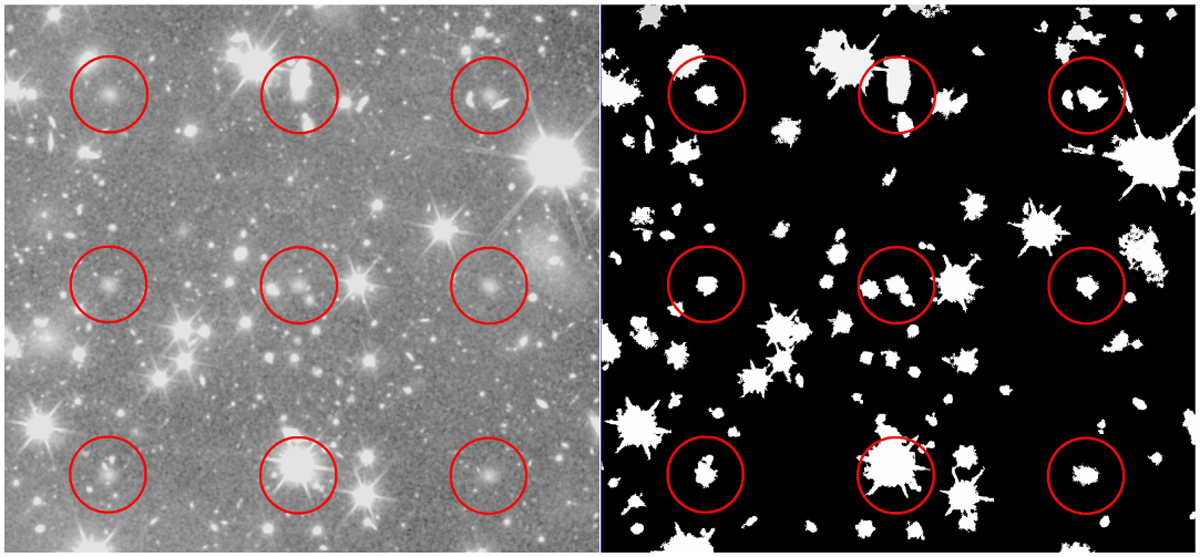
Image of a 75″ wide area featuring nine injected dwarf galaxies (the same as shown in Fig. 16). Two galaxies are not recovered. The centre top red circle overlaps with a background galaxy, and the centre bottom overlaps with a bright star. The segmentation map on the right displays a single polygon at the location of each simulated dwarf, highlighting where recoveries succeeded and where they were hindered by overlapping objects.
Current usage metrics show cumulative count of Article Views (full-text article views including HTML views, PDF and ePub downloads, according to the available data) and Abstracts Views on Vision4Press platform.
Data correspond to usage on the plateform after 2015. The current usage metrics is available 48-96 hours after online publication and is updated daily on week days.
Initial download of the metrics may take a while.