Fig. 12
Download original image
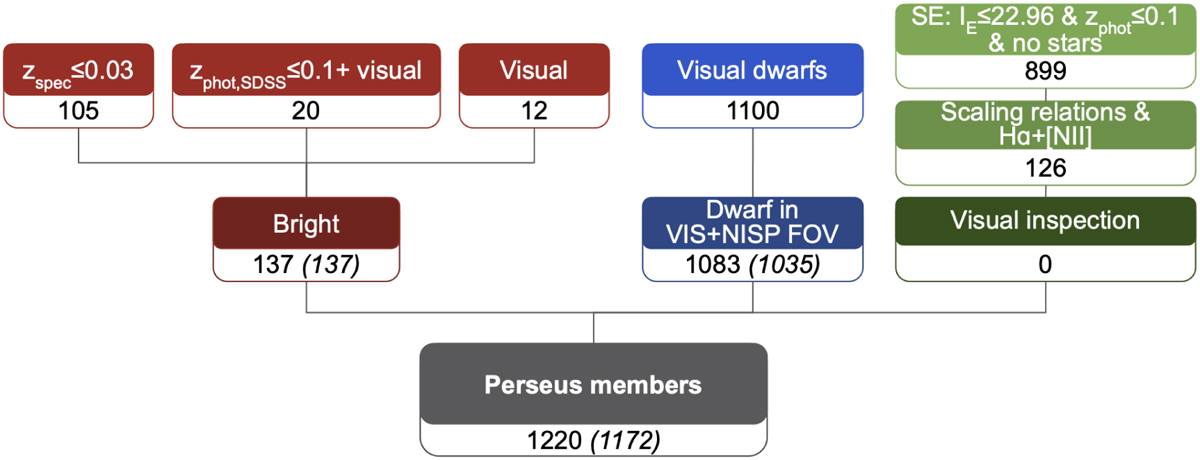
Flowchart representing the process of selecting cluster members. The red branch in the left represents the steps described in Sect. 5.1. The blue boxes are for the dwarf galaxies in Sect. 5.2, and in green we illustrate the different steps we followed to check for any possible additional member, starting from the SourceExtractor (SE on the flowchart) catalogue, discussed in Sect. 5.4. Numbers in italic and between parentheses represent the galaxies brighter than the completeness limit we adopted for the LF, M(IE) ≤ −11.33.
Current usage metrics show cumulative count of Article Views (full-text article views including HTML views, PDF and ePub downloads, according to the available data) and Abstracts Views on Vision4Press platform.
Data correspond to usage on the plateform after 2015. The current usage metrics is available 48-96 hours after online publication and is updated daily on week days.
Initial download of the metrics may take a while.