Fig. 11

Download original image
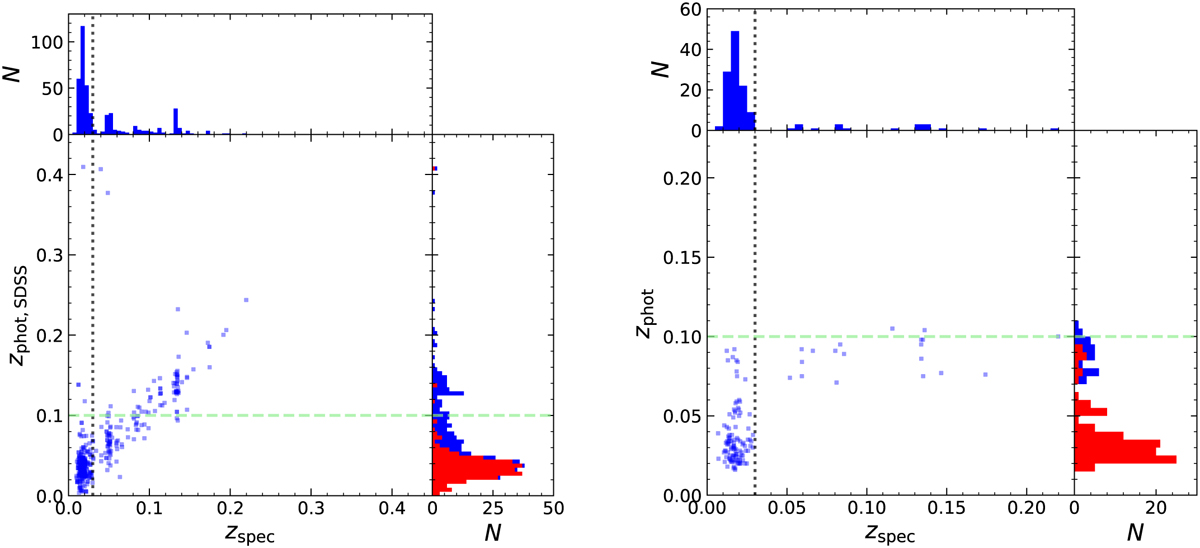
Left: Comparison between the SDSS photometric redshift and the spectroscopic one for targets located within R ≤ r200 in the Perseus cluster with an r-band magnitude r ≲ 17.7. Right: Comparison between the photometric redshifts derived with Phosphoros and the spectroscopic ones for targets located within the Euclid field of the Perseus cluster (R ≤ 0.25 r200). The vertical black dotted line shows the adopted limit in spectroscopic redshift used for identifying Perseus members [zspec ≲ 0.03, corresponding to Vc + 3.5 σc = (5258 + 3.5 × 1040) km s−1]. The green dashed line shows the limit in photometric redshift to identify potential cluster candidates [zphot,SDSs ≲ 0.1, left; zphot ≲ 0.1, right]. The upper and right histograms show the spectroscopic and photometric redshift distribution, respectively, for all galaxies and for those objects classified as cluster members using their spectroscopic redshift (zspec ≲ 0.03, red).
Current usage metrics show cumulative count of Article Views (full-text article views including HTML views, PDF and ePub downloads, according to the available data) and Abstracts Views on Vision4Press platform.
Data correspond to usage on the plateform after 2015. The current usage metrics is available 48-96 hours after online publication and is updated daily on week days.
Initial download of the metrics may take a while.


