Fig. 5
Download original image
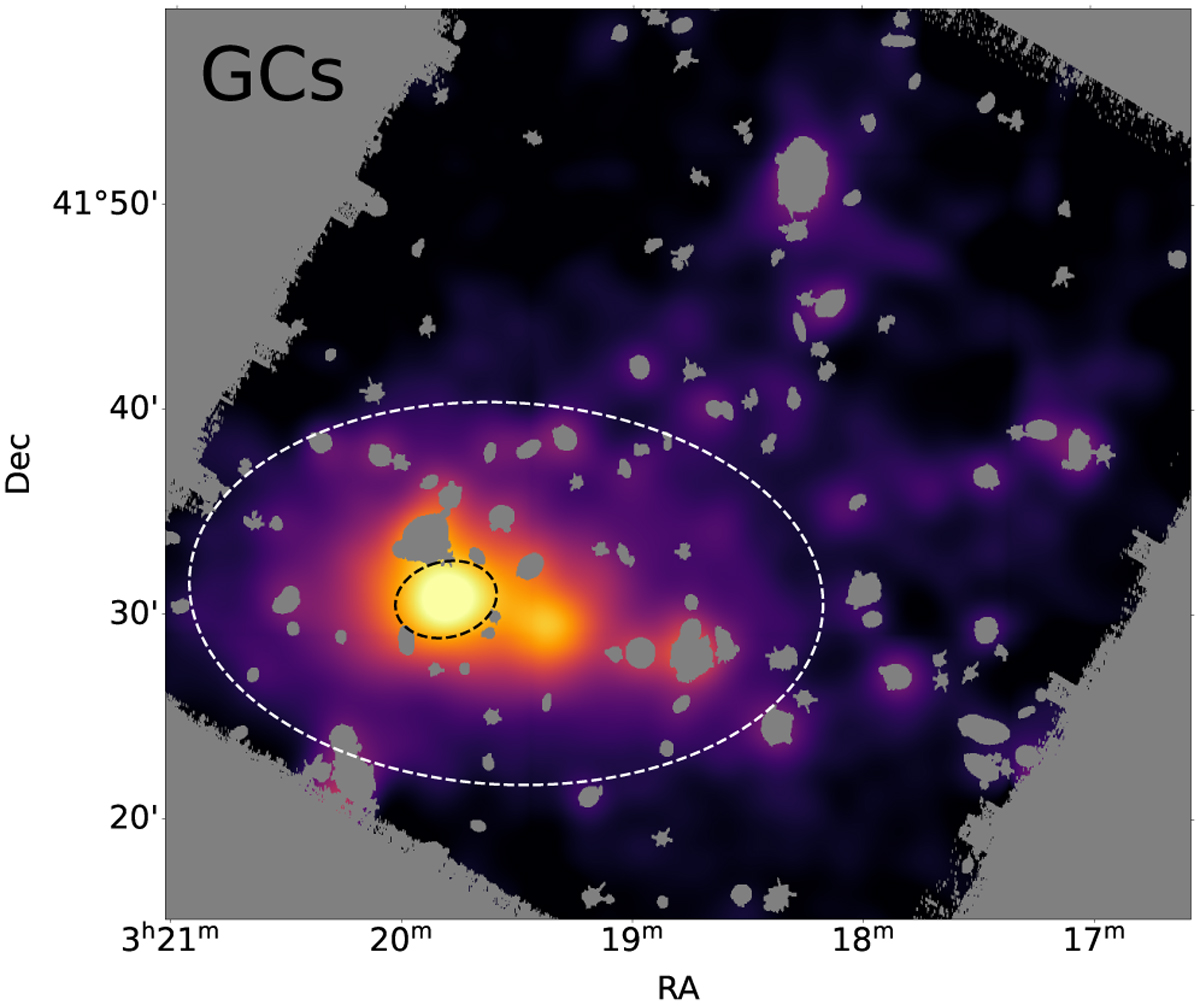
Map of the number density distribution of GC candidates. It was produced by modelling each GC candidate as a single pixel with unity flux and then smoothed with a Gaussian kernel of σ = 50″. The colour scheme therefore represents the GC number density. We masked bright stars, diffraction spike residuals, the emission line nebula, and the high- velocity system of NGC 1275, as well as large cluster galaxies (except for the NGC 1275 and its nearby companion in the west, NGC 1272). Iso-density contours with a semi-major axis of a = 50 kpc (black) and 320 kpc (white) are shown for the GC candidates.
Current usage metrics show cumulative count of Article Views (full-text article views including HTML views, PDF and ePub downloads, according to the available data) and Abstracts Views on Vision4Press platform.
Data correspond to usage on the plateform after 2015. The current usage metrics is available 48-96 hours after online publication and is updated daily on week days.
Initial download of the metrics may take a while.