Fig. B.1
Download original image
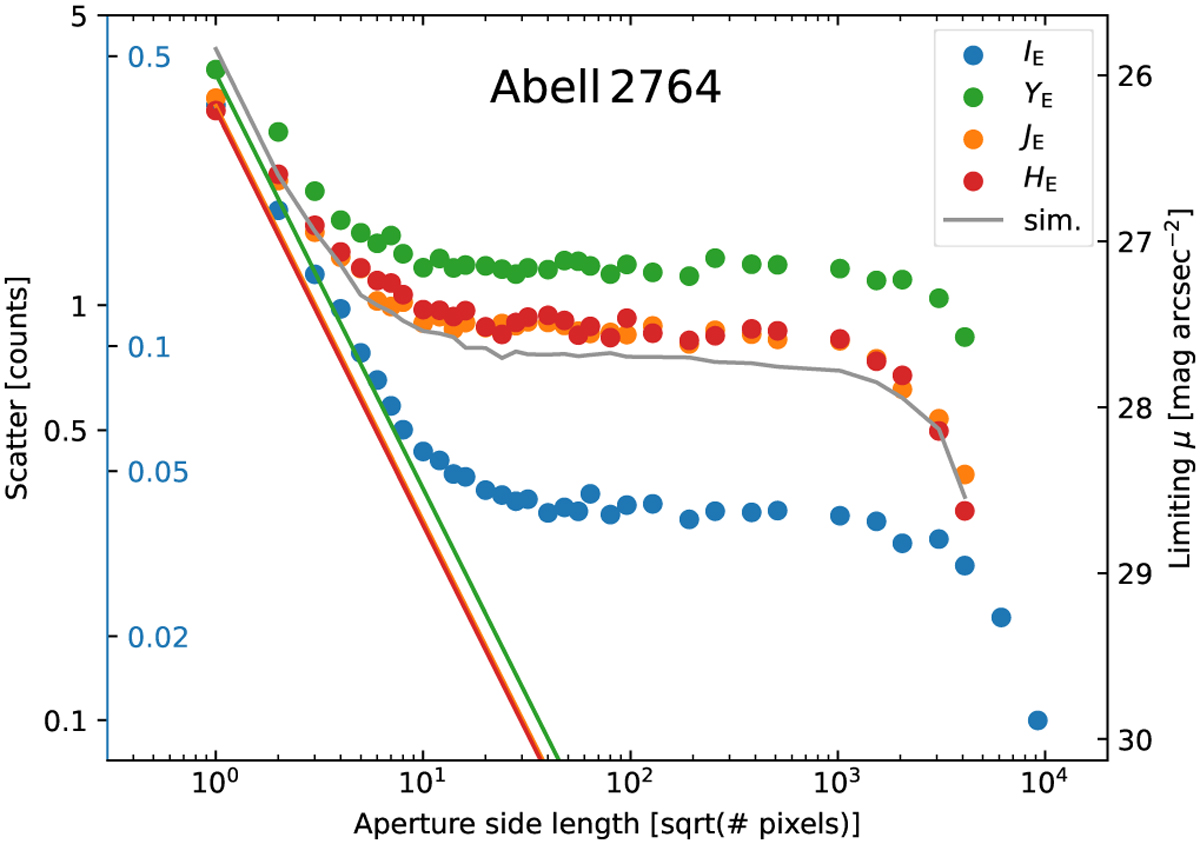
Standard deviation of the mean pixel values in randomly placed square apertures with increasing size. Diagonal lines correspond to pure Poissonian noise while upward deviations indicate systematic background inhomogeneities. The grey line is derived from simulations of white noise with random constants added to each simulated NISP-detector image.
Current usage metrics show cumulative count of Article Views (full-text article views including HTML views, PDF and ePub downloads, according to the available data) and Abstracts Views on Vision4Press platform.
Data correspond to usage on the plateform after 2015. The current usage metrics is available 48-96 hours after online publication and is updated daily on week days.
Initial download of the metrics may take a while.