Fig. 11
Download original image
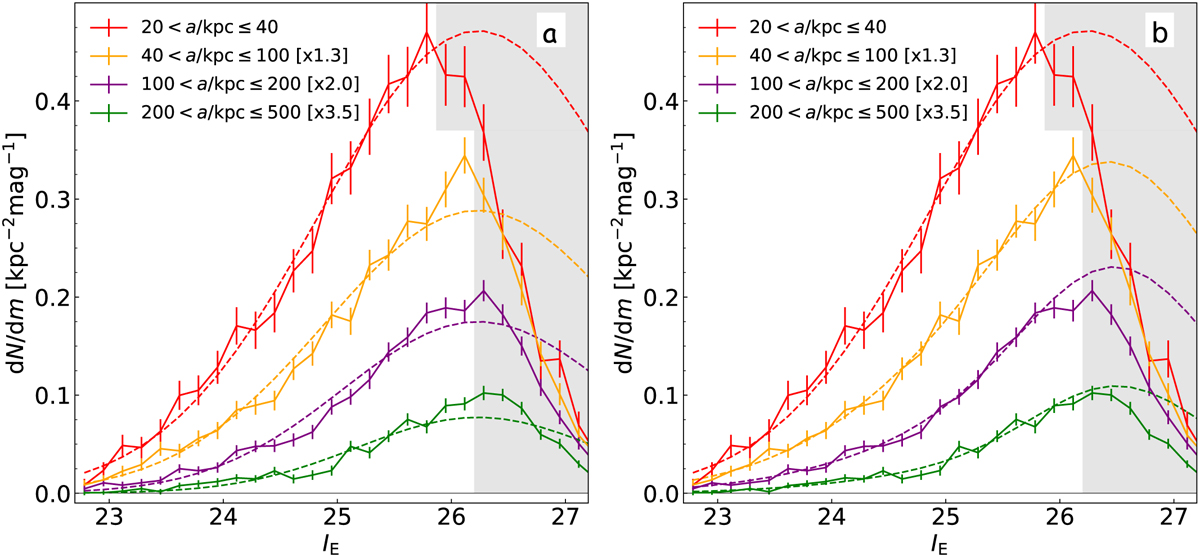
Luminosity function of GC candidates in various elliptical annuli surrounding the BCG. The luminosity function of background sources has been scaled to the area within each annulus and subtracted from each luminosity function. The data have been scaled for clarity according to the numbers shown in the legend. The greyed-out area marks the region where the GC candidate selection is less than 95% complete. Regions of high surface brightness such as the centre of the BCG are incomplete to a brighter point source magnitude. In panel a (left), the dashed lines display the single Gaussian that is the best-fit to the luminosity function in each annulus, where the fit is limited to only magnitudes that are >95% complete (i.e. non-greyed-out regions). The best-fit Gaussian parameters are listed in Table 3. In panel b (right), the yellow, purple and green dashed lines show the 2-component Gaussian distributions that are the best-fit to the luminosity function at IE < 26.2 (non-greyed-out regions) for the annuli with a > 40 kpc. The best-fit 2-component Gaussian parameters are listed in Table 4.
Current usage metrics show cumulative count of Article Views (full-text article views including HTML views, PDF and ePub downloads, according to the available data) and Abstracts Views on Vision4Press platform.
Data correspond to usage on the plateform after 2015. The current usage metrics is available 48-96 hours after online publication and is updated daily on week days.
Initial download of the metrics may take a while.