Fig. 2
Download original image
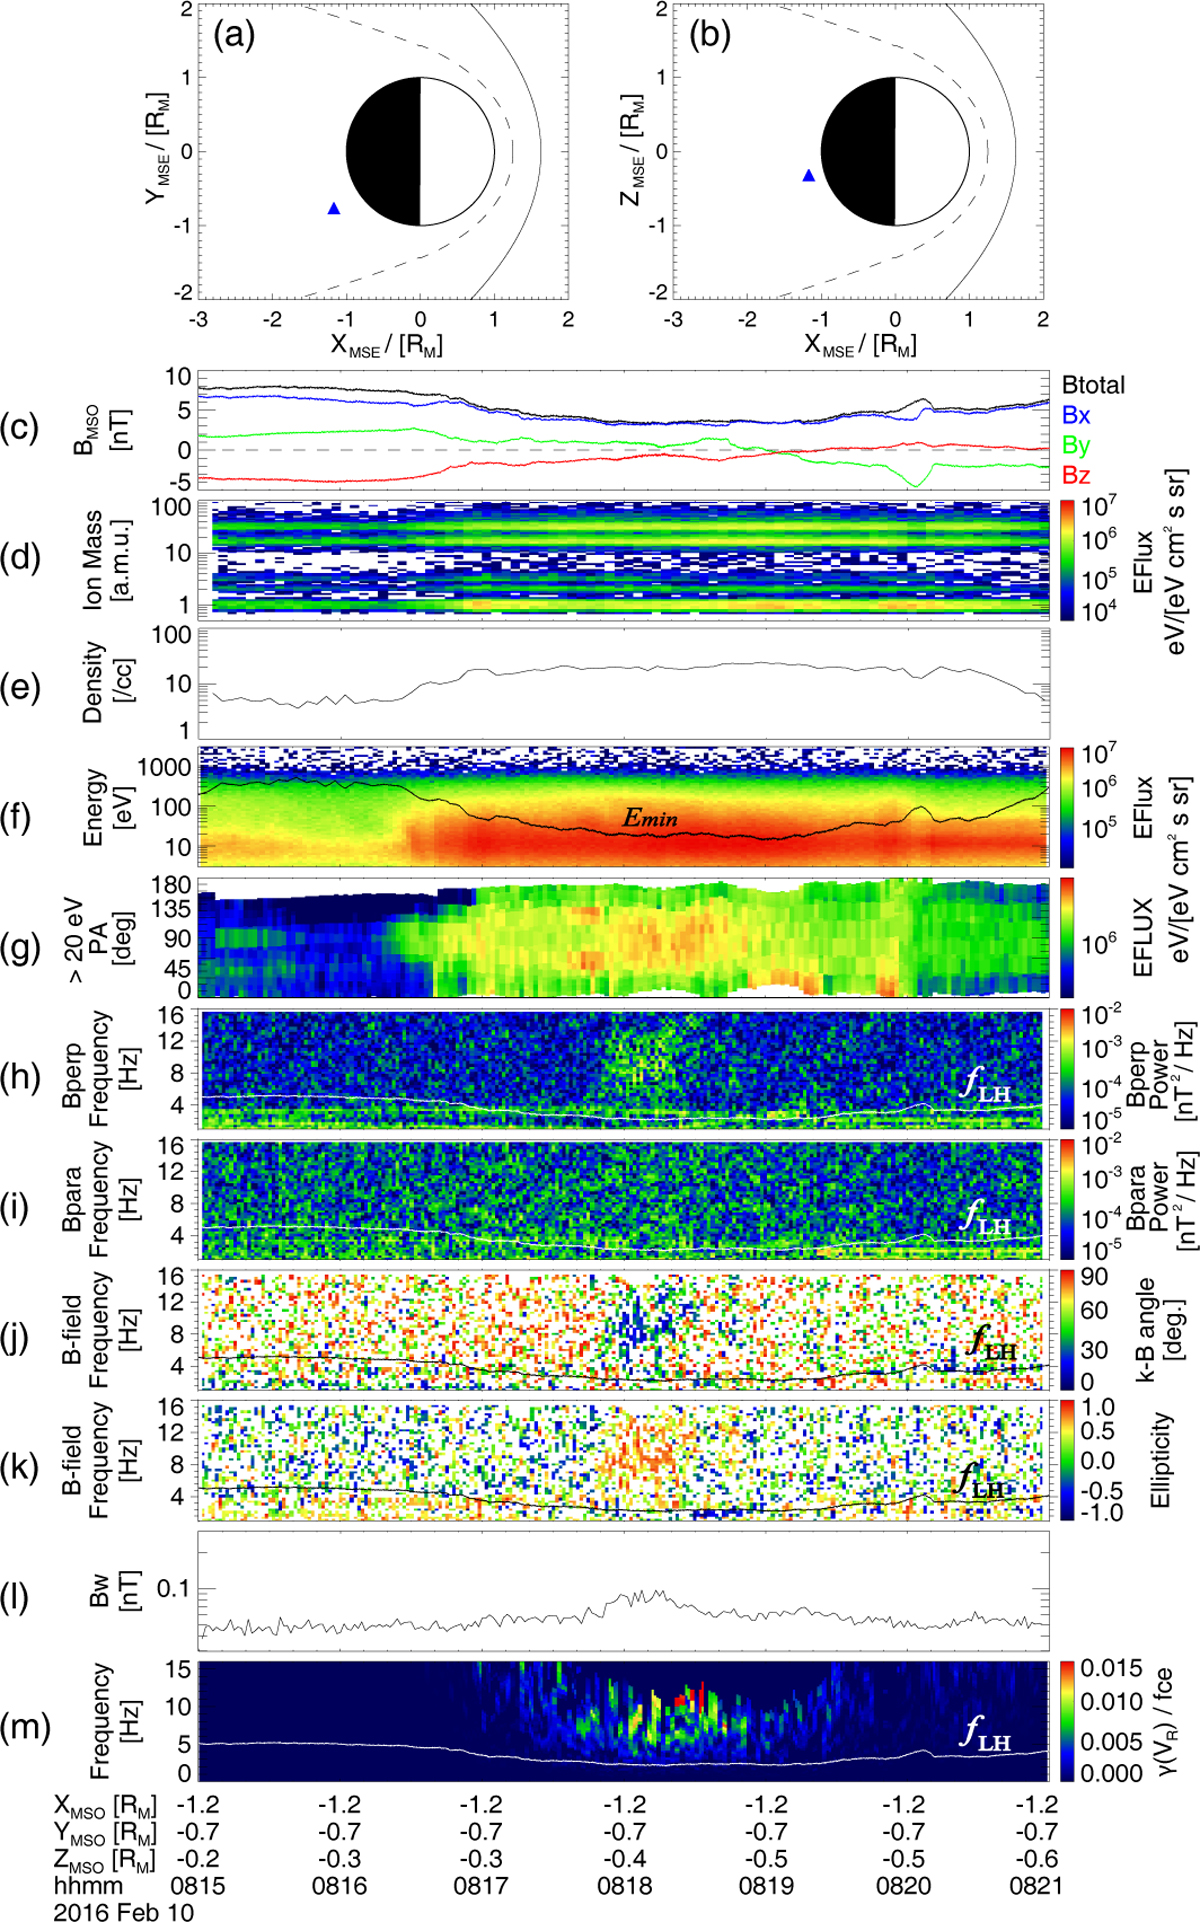
Overview of a whistler-mode wave case. (a) Wave location (blue triangle) in the MSE-XY plane. (b) Wave location (blue triangle) in the XZ plane. (c) Total magnetic field intensity Bt (black) and three components (blue: Bx, green: By, and red: Bz) in MSO coordinates. (d) Ion mass spectrogram. (e) Plasma density. (f) Electron energy spectrogram with the minimum cyclotron resonant energy of 0.07 fc e whistler-mode waves (black line). (g) Pitch angle distributions of the electrons with energy ̌20 eV. Frequency spectrograms of (h) transverse and (i) parallel components of the magnetic field. (j) Wave normal angle and (k) ellipticity. (1) Integrated wave amplitude with frequency higher than the lower hybrid frequency fL H. (m) Theoretical linear wave growth rate. The dashed and solid curves in (a) and (b) represent the nominal location of the Martian magnetic pile-up boundary and bow shock (Trotignon et al. 2006). White lines in (h, i, m) and black lines in (j, k) represent fL H.
Current usage metrics show cumulative count of Article Views (full-text article views including HTML views, PDF and ePub downloads, according to the available data) and Abstracts Views on Vision4Press platform.
Data correspond to usage on the plateform after 2015. The current usage metrics is available 48-96 hours after online publication and is updated daily on week days.
Initial download of the metrics may take a while.