Fig. 6.
Download original image
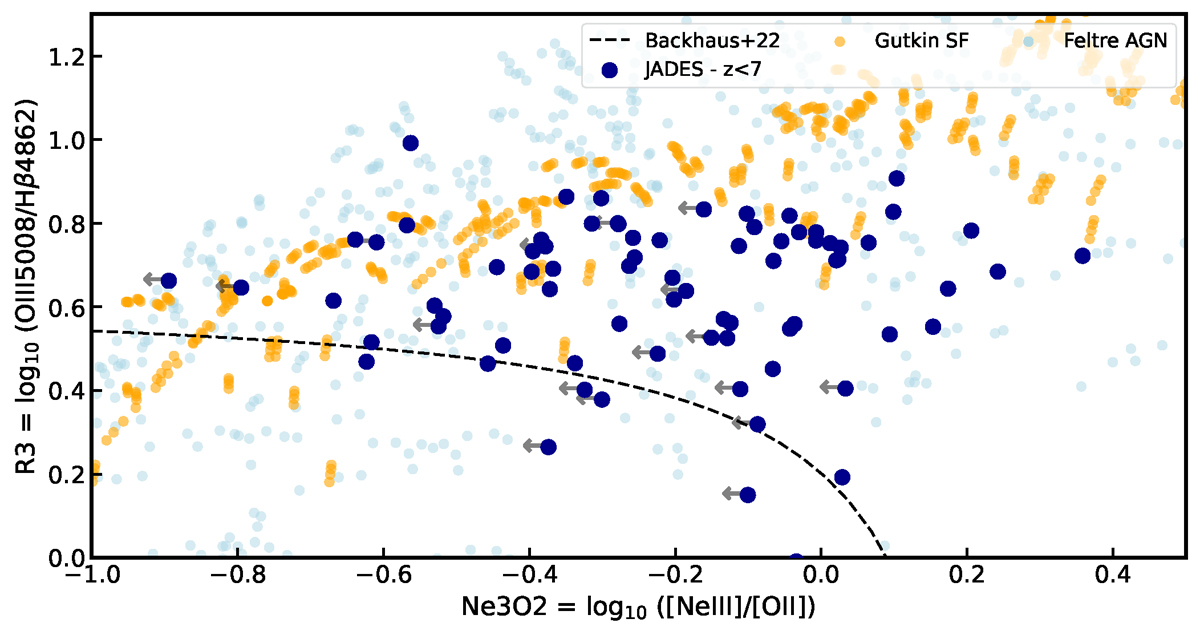
Diagram of [O III] /Hβ versus [NeIII]/[OII] diagram. The black dashed lines show the boundary between AGN and star-forming galaxies from Backhaus et al. (2022). The light blue and orange points show star-forming and AGN photoionisation models from Feltre et al. (2016) and Gutkin et al. (2016), respectively. There is a significant overlap between AGN and star forming galaxies in this diagram, making it unreliable to select AGN.
Current usage metrics show cumulative count of Article Views (full-text article views including HTML views, PDF and ePub downloads, according to the available data) and Abstracts Views on Vision4Press platform.
Data correspond to usage on the plateform after 2015. The current usage metrics is available 48-96 hours after online publication and is updated daily on week days.
Initial download of the metrics may take a while.