Fig. 3.
Download original image
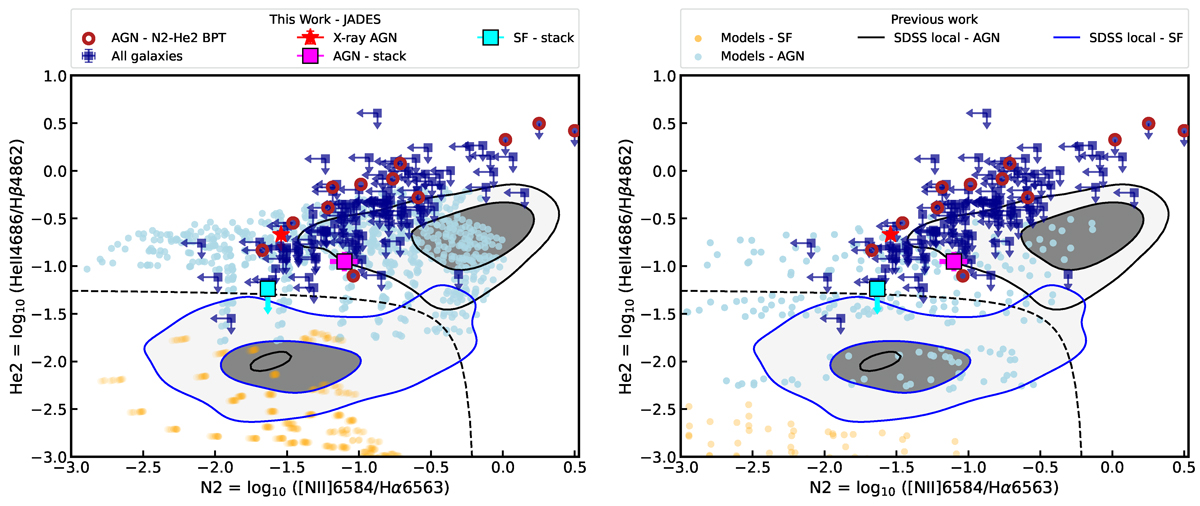
Diagram of He2-N2 (He II /Hβ versus [N II]/Hα) diagram for the sample of JADES galaxies for our sample, plotted as blue squares. The left and right plots show ionisation models from Feltre et al. (2016), Gutkin et al. (2016) and Nakajima & Maiolino (2022), respectively, as yellow and light blue points (see Sect. 2.4). The magenta and cyan squares show a stacked spectrum for AGN and star-forming galaxies (see Sect. 4.1). The black dashed line indicates a demarcation line between star-forming and AGN galaxies by Shirazi & Brinchmann (2012). The blue and black contours show the star-forming galaxies and AGN from SDSS, respectively. We highlight the selected AGN in this diagram with a red circle.
Current usage metrics show cumulative count of Article Views (full-text article views including HTML views, PDF and ePub downloads, according to the available data) and Abstracts Views on Vision4Press platform.
Data correspond to usage on the plateform after 2015. The current usage metrics is available 48-96 hours after online publication and is updated daily on week days.
Initial download of the metrics may take a while.