Fig. 2.
Download original image
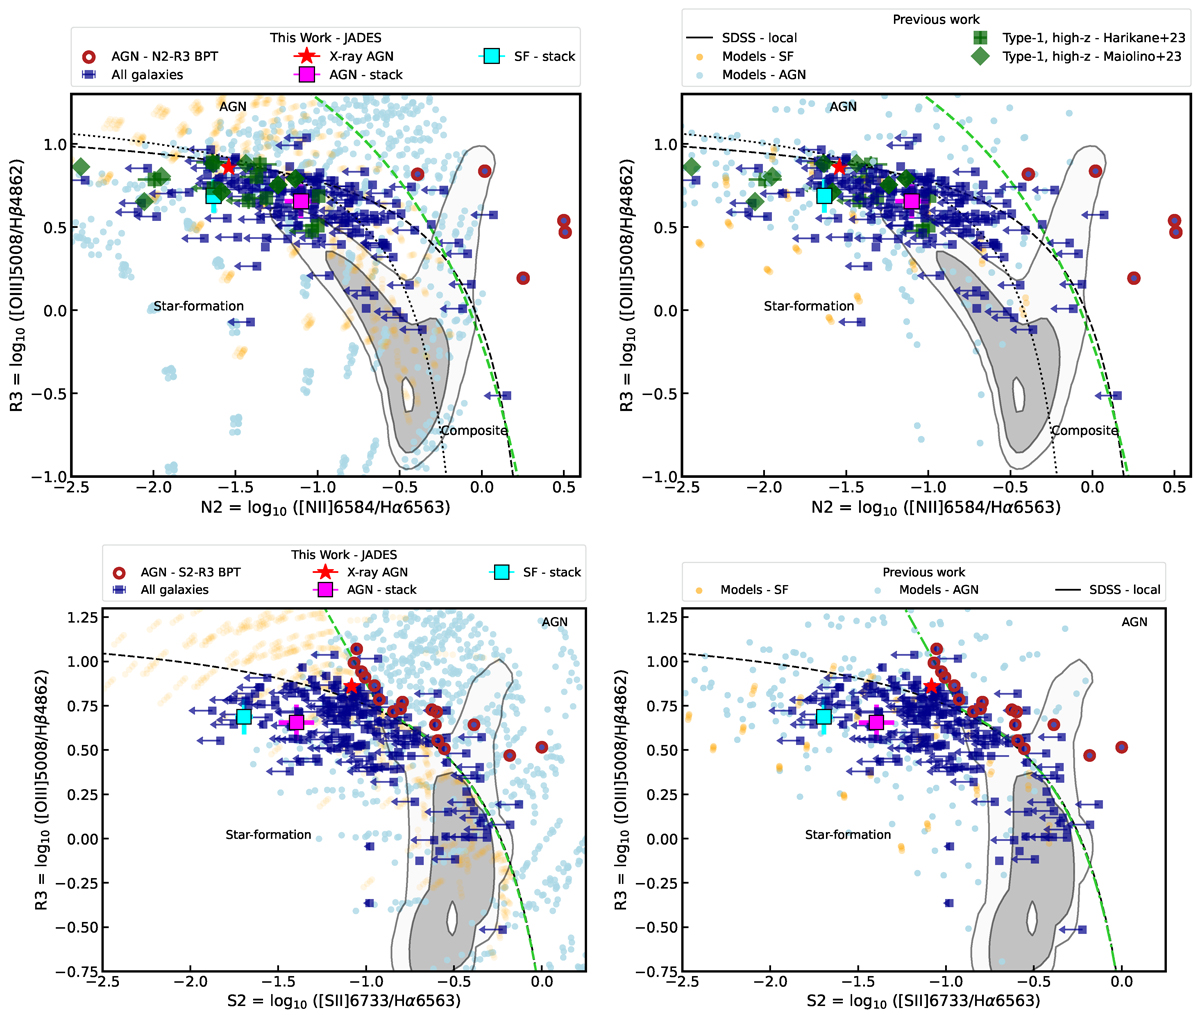
Typical line ratio diagnostic diagrams used to select AGN. N2-R3 BPT ([N II]/Hα versus [O III]/Hβ; top row) and S2-VO87 ([S II]/Hα versus [O III]/Hβ; bottom row). The ionisation models of Feltre et al. (2016), Gutkin et al. (2016) (left) and Nakajima & Maiolino (2022) (right) are reported as yellow (SF) and blue (AGN) points (see Sect. 2.4). The objects from this work are plotted as blue squares. The objects selected as AGN based in these diagrams are highlighted by red circles. We also plot our new demarcation lines as green dashed line. The black dashed lines show the star forming versus AGN demarcation lines from Kewley et al. (2001) and Kauffmann et al. (2003). For comparison, we plot SDSS galaxies, shown as a grey contour plot. The magenta and cyan squares show a stacked spectrum for AGN and star-forming galaxies (see Sect. 4.1). We highlight type-1 AGN from Harikane et al. (2023) and Maiolino et al. (2024b) as green squares and diamonds. The red star shows the X-ray selected AGN in our sample.
Current usage metrics show cumulative count of Article Views (full-text article views including HTML views, PDF and ePub downloads, according to the available data) and Abstracts Views on Vision4Press platform.
Data correspond to usage on the plateform after 2015. The current usage metrics is available 48-96 hours after online publication and is updated daily on week days.
Initial download of the metrics may take a while.