Open Access
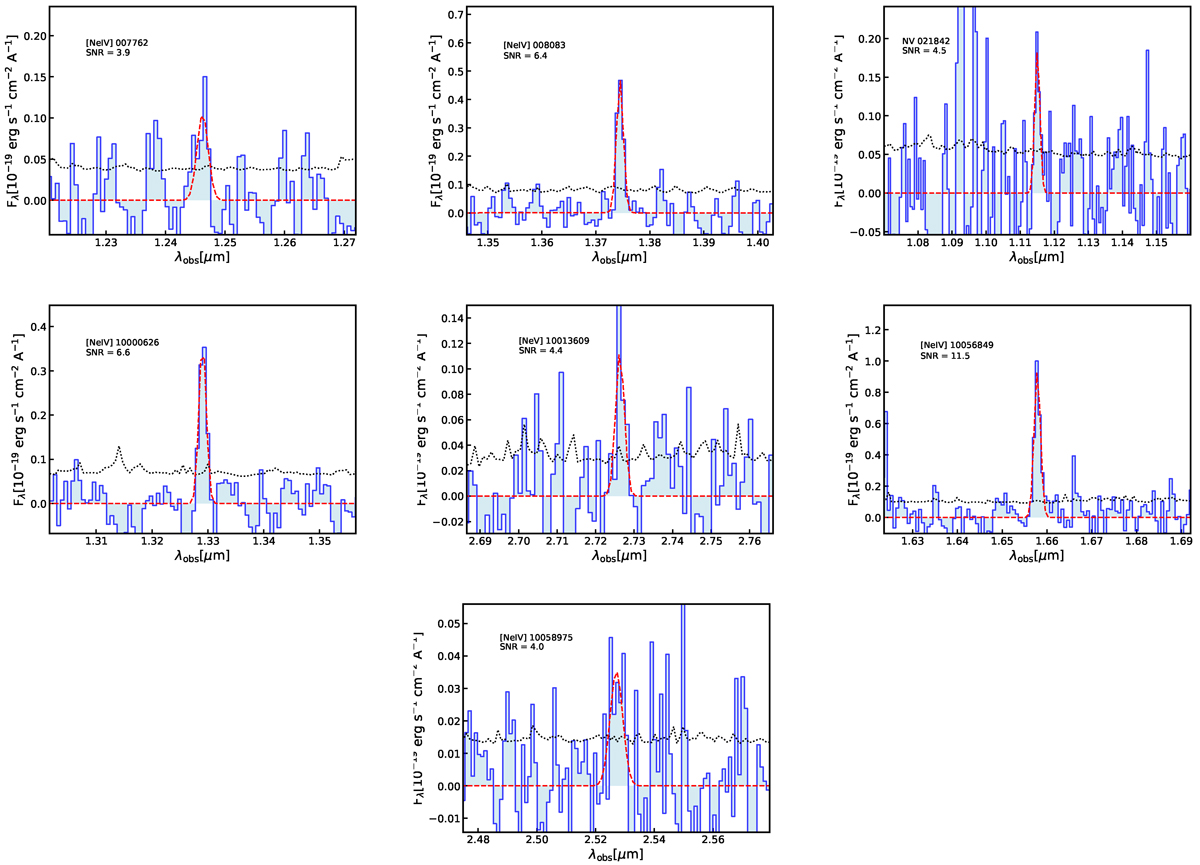
Fig. D.1.
Download original image
Summary of the detection of [Ne IV] λ2424, [Ne V] λ3420, and NVλ1240. The blue lines show the continuum subtracted observed spectrum, black dotted lines indicate the uncertainties on the flux and the red dashed lines show the best fit to the data.
Current usage metrics show cumulative count of Article Views (full-text article views including HTML views, PDF and ePub downloads, according to the available data) and Abstracts Views on Vision4Press platform.
Data correspond to usage on the plateform after 2015. The current usage metrics is available 48-96 hours after online publication and is updated daily on week days.
Initial download of the metrics may take a while.