Fig. 11.
Download original image
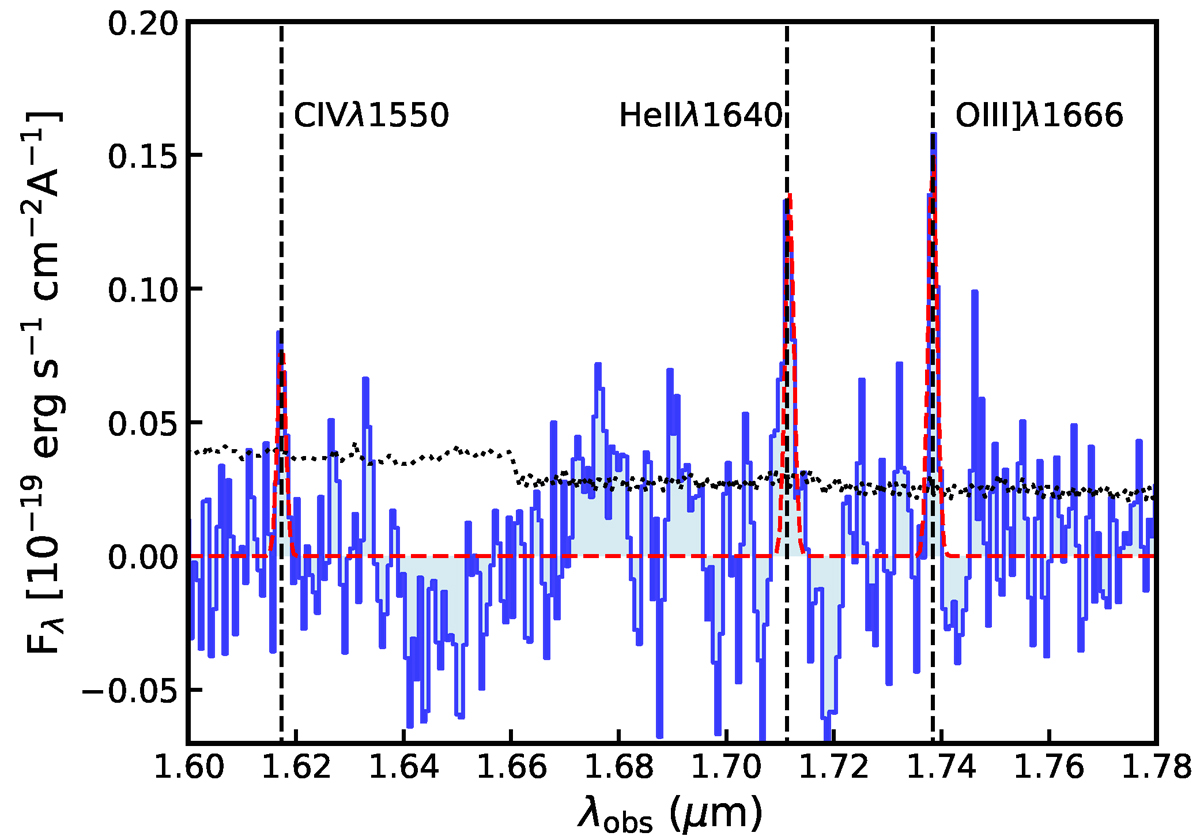
Detection of C IVλλ1548,50, He IIλ1640 and [O III] λ1666 in object ID 10058975 (JADES-GS+53.11243-27.77461) at z = 9.43. The spectrum is a combined spectrum of the Band-1 and Band-2 data from program ID 1210 and Band-1 data from program ID 3215 to increase the S/N of the detection. The black dotted line shows the flux uncertainties. The blue line shows the continuum subtracted observed spectrum, while the red dashed line shows the best fit to the data.
Current usage metrics show cumulative count of Article Views (full-text article views including HTML views, PDF and ePub downloads, according to the available data) and Abstracts Views on Vision4Press platform.
Data correspond to usage on the plateform after 2015. The current usage metrics is available 48-96 hours after online publication and is updated daily on week days.
Initial download of the metrics may take a while.