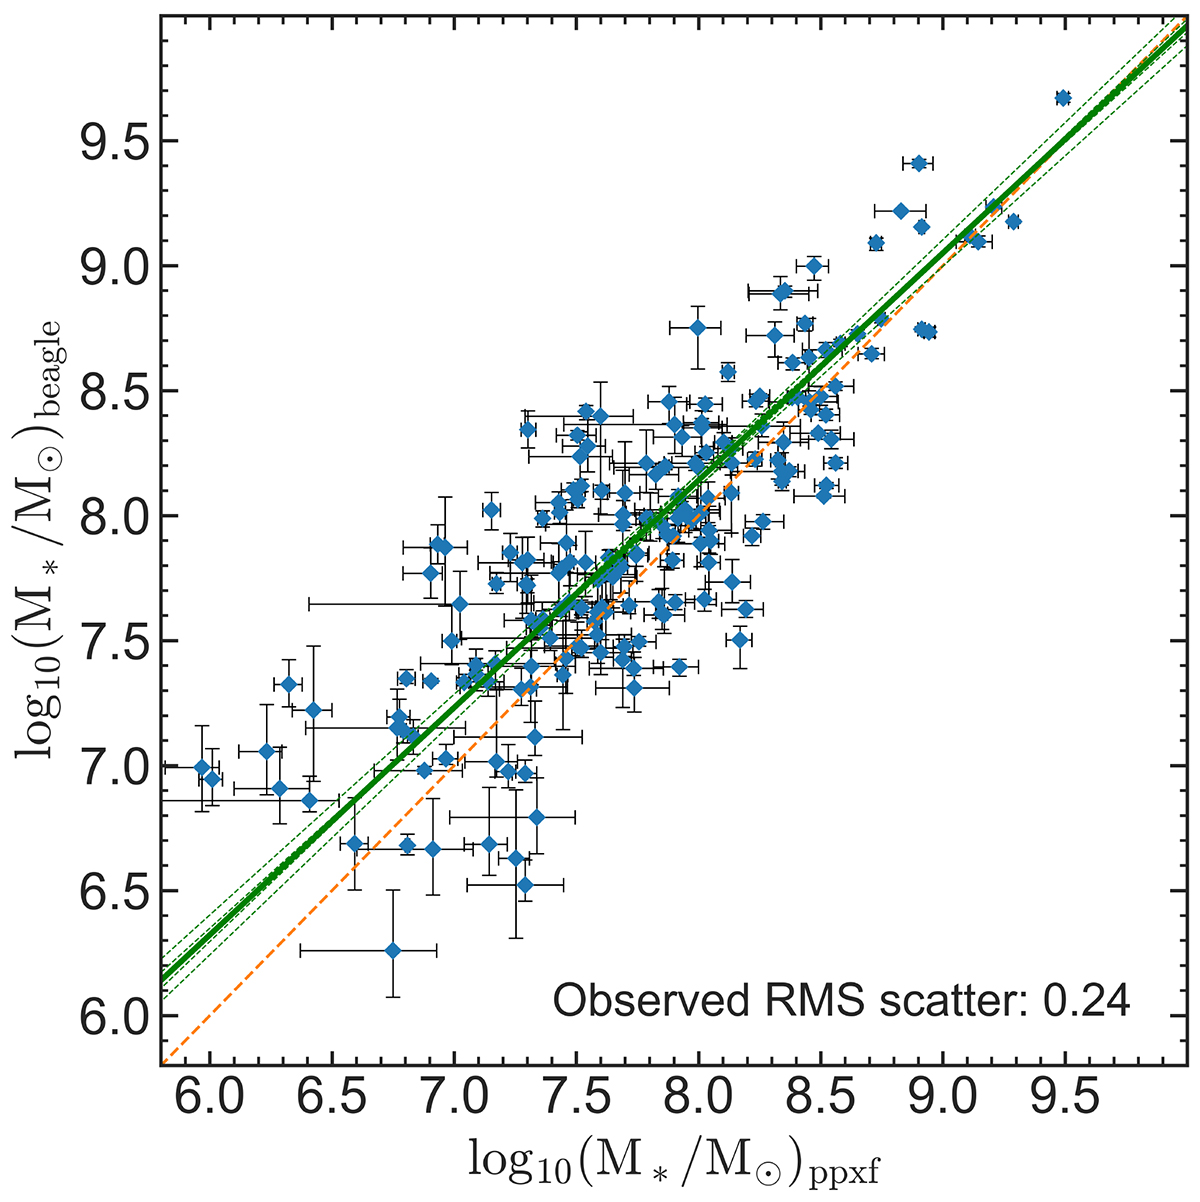
Fig. B.1.
Download original image
Comparison between the stellar masses inferred by PPXF and BEAGLE. The orange line indicates the 1:1 line. The green solid line show the best-fit relation between the two mass-estimated. The dashed green lines show the 1-sigma error on the best-fit. The masses show a strong correlation, with an RMS-scatter of 0.2 dex, but an offset of 0.2 dex at the low-mass end.
Current usage metrics show cumulative count of Article Views (full-text article views including HTML views, PDF and ePub downloads, according to the available data) and Abstracts Views on Vision4Press platform.
Data correspond to usage on the plateform after 2015. The current usage metrics is available 48-96 hours after online publication and is updated daily on week days.
Initial download of the metrics may take a while.