| Issue |
A&A
Volume 696, April 2025
|
|
|---|---|---|
| Article Number | C5 | |
| Number of page(s) | 2 | |
| Section | Planets, planetary systems, and small bodies | |
| DOI | https://doi.org/10.1051/0004-6361/202554767e | |
| Published online | 29 April 2025 | |
First absolute wind measurements in Saturn’s stratosphere from ALMA observations (Corrigendum)
1
Laboratoire d’Astrophysique de Bordeaux, Univ. Bordeaux, CNRS, B18N,
allée Geoffroy Saint-Hilaire,
33615
Pessac,
France
2
LESIA, Observatoire de Paris, Université PSL, CNRS, Sorbonne Université, Univ. Paris Diderot,
Sorbonne Paris Cité, 5 place Jules Janssen,
92195
Meudon,
France
3
School of Physics and Astronomy, University of Leicester,
University Road,
Leicester
LE1 7RH,
UK
4
Laboratoire de Météorologie Dynamique/Institut Pierre-Simon Laplace (LMD/IPSL), Sorbonne Université, Centre National de la Recherche Scientifique (CNRS), Ecole Polytechnique, Ecole Normale Supérieure (ENS),
Campus Pierre et Marie Curie BC99, 4 place Jussieu,
75005
Paris,
France
5
Southwest Research Institute,
San Antonio,
TX 78228,
USA
6
Institut Universitaire de France,
1 rue Descartes,
75005
Paris,
France
★ Corresponding author; This email address is being protected from spambots. You need JavaScript enabled to view it.
Key words: planets and satellites: atmospheres / planets and satellites: gaseous planets / planets and satellites: individual: Saturne / errata, addenda
We have identified an error in the conversion of the pointing positions into Saturn’s latitude-longitude coordinate system. This conversion error resulted in a shift in the positions of up to approximately 5° in latitude towards the planet’s north pole, affecting the position of the jets presented in Figures 7, 8, 9, and 11 of the original paper.
We have corrected this issue by accurately recalculating the pointing positions, which allowed us to refine the latitudes of the measured stratospheric winds.We provide the corrected versions of Figures 7, 8, 9, and 11 of the original paper in this erratum as Figures 1, 2, 3, and 4.
The main conclusions regarding the winds at mid and equatorial latitudes remain unchanged. However, in Section 4.4, the interpretation of the polar jet, tentatively detected at 71°N in the HCN emission, must be revised. This jet is actually located at 66°N, and its position no longer coincides with Saturn’s main northern auroral oval. It lies at the outer periphery of the main auroral oval, which makes it thus more difficult to associate it solely with the planet’s auroral activity.
Considering the energy input from magnetospheric precipitation, Saturn’s stratospheric auroral regions could be heated, as observed on Jupiter (Sinclair et al. 2017). Therefore, this jet at 66.N could be driven by the zonal shear induced by the thermal gradient between the main emission region and the outer periphery of the auroral oval. It is also possible that this jet is driven by the transfer of angular momentum through the propagation of planetary waves from equatorial and mid-latitude regions.
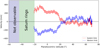 |
Fig. 1 Correction of Fig. 7: line-of-sight wind speeds derived from the CO (3–2) observations. The speeds measured at the eastern and western limbs are displayed in red and blue, respectively. |
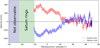 |
Fig. 2 Correction of Fig. 8: line-of-sight wind speeds derived from the HCN (4–3) observations. The layout is the same as in Figure 1. |
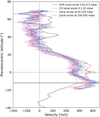 |
Fig. 3 Correction of Fig. 9: zonally averaged eastward winds from CO and HCN observations compared with the García-Melendo et al. (2011) measurements. The eastward winds for HCN and CO are obtained by averaging the winds between the two limbs of the planet, i.e. |


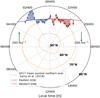 |
Fig. 4 Correction of Fig. 11: line-of-sight jet speeds and directions north of 65°N compared to the statistical average position of Saturn’s northern main auroral oval in 2017, as observed by Lamy et al. (2018). The red and blue arrows represent the speeds at the eastern and western limbs, respectively. The strongest winds occur around 66°N at both limbs. The green arrow key at the top right of the plot indicates a speed of 200 m/s. |
References
- García-Melendo, E., Pérez-Hoyos, S., Sánchez-Lavega, A., & Hueso, R. 2011, Icarus, 215, 62 [CrossRef] [Google Scholar]
- Lamy, L., Prangé, R., Tao, C., et al. 2018, Geophys. Res. Lett., 45, 9353 [NASA ADS] [CrossRef] [Google Scholar]
- Sinclair, J. A., Orton, G. S., Greathouse, T. K., et al. 2017, Icarus, 292, 182 [NASA ADS] [CrossRef] [Google Scholar]
© The Authors 2025
 Open Access article, published by EDP Sciences, under the terms of the Creative Commons Attribution License (https://creativecommons.org/licenses/by/4.0), which permits unrestricted use, distribution, and reproduction in any medium, provided the original work is properly cited.
This article is published in open access under the Subscribe to Open model. This email address is being protected from spambots. You need JavaScript enabled to view it. to support open access publication.
All Figures
|
Fig. 1 Correction of Fig. 7: line-of-sight wind speeds derived from the CO (3–2) observations. The speeds measured at the eastern and western limbs are displayed in red and blue, respectively. |
| In the text | |
|
Fig. 2 Correction of Fig. 8: line-of-sight wind speeds derived from the HCN (4–3) observations. The layout is the same as in Figure 1. |
| In the text | |
|
Fig. 3 Correction of Fig. 9: zonally averaged eastward winds from CO and HCN observations compared with the García-Melendo et al. (2011) measurements. The eastward winds for HCN and CO are obtained by averaging the winds between the two limbs of the planet, i.e. |
| In the text | |
|
Fig. 4 Correction of Fig. 11: line-of-sight jet speeds and directions north of 65°N compared to the statistical average position of Saturn’s northern main auroral oval in 2017, as observed by Lamy et al. (2018). The red and blue arrows represent the speeds at the eastern and western limbs, respectively. The strongest winds occur around 66°N at both limbs. The green arrow key at the top right of the plot indicates a speed of 200 m/s. |
| In the text | |
Current usage metrics show cumulative count of Article Views (full-text article views including HTML views, PDF and ePub downloads, according to the available data) and Abstracts Views on Vision4Press platform.
Data correspond to usage on the plateform after 2015. The current usage metrics is available 48-96 hours after online publication and is updated daily on week days.
Initial download of the metrics may take a while.