| Issue |
A&A
Volume 696, April 2025
|
|
|---|---|---|
| Article Number | L17 | |
| Number of page(s) | 6 | |
| Section | Letters to the Editor | |
| DOI | https://doi.org/10.1051/0004-6361/202554395 | |
| Published online | 25 April 2025 | |
Letter to the Editor
Extremely asymmetric bipolar magnetic field of the Bp star HD 57372⋆
Department of Physics and Astronomy, Uppsala University, Box 516 75120 Uppsala, Sweden
⋆⋆ Corresponding author: This email address is being protected from spambots. You need JavaScript enabled to view it.
Received:
6
March
2025
Accepted:
8
April
2025
Abstract
Fossil magnetic fields of early-type stars are typically characterised by symmetric or slightly distorted oblique dipolar surface geometries. Contrary to this trend, the late-B magnetic chemically peculiar star HD 57372 exhibits an unusually large rotational variation of its mean magnetic field modulus, suggesting a highly atypical field configuration. We present a Zeeman Doppler imaging analysis of HD 57372 that reveals an exceptionally asymmetric bipolar magnetic topology, which is rarely observed in early-type stars. According to our magnetic field maps, reconstructed from the intensity and circular polarisation profiles of Fe, Cr, and Ti lines, approximately 66% of the stellar surface is covered by a diffuse, outward directed radial field, with local field strength reaching 11.6 kG. The remaining 34% hosts a highly concentrated inward directed field with a strong horizontal component and a peak strength of 17.8 kG. These unusual surface magnetic field characteristics make HD 57372 a notable object for testing fossil-field theories and interpreting phase-resolved spectropolarimetric observations of early-type stars.
Key words: polarization / stars: chemically peculiar / stars: early-type / stars: magnetic field / stars: individual: HD 57372
Based on data obtained from the ESO Science Archive Facility.
© The Authors 2025
 Open Access article, published by EDP Sciences, under the terms of the Creative Commons Attribution License (https://creativecommons.org/licenses/by/4.0), which permits unrestricted use, distribution, and reproduction in any medium, provided the original work is properly cited.
This article is published in open access under the Subscribe to Open model. This email address is being protected from spambots. You need JavaScript enabled to view it. to support open access publication.
1. Introduction
Magnetic fields play a fundamental role in the physics of stars, influencing their structure, evolution, and interaction with their surroundings. In about 7–10% of early-type stars – those of spectral types O, B, and A – the presence of large-scale surface magnetic fields has been firmly established through spectropolarimetric observations (Donati & Landstreet 2009; Morel et al. 2015; Wade et al. 2016; Grunhut et al. 2017). Unlike the turbulent, convective dynamos responsible for magnetic activity in late-type stars, early-type stars lack significant outer convection zones, and their magnetic fields are believed to be fossil remnants of primordial magnetic flux trapped during star formation or generated by early binary mergers (Braithwaite & Spruit 2004; Schneider et al. 2019). These fields can strongly affect stellar winds, rotation, and angular momentum evolution, leading to complex magnetospheric structures (Petit et al. 2013; Keszthelyi 2023).
The majority of magnetic early-type stars exhibit relatively simple, large-scale field geometries, most commonly approximated by a tilted dipole, with strengths ranging from a few hundred gauss to tens of kilogauss (Aurière et al. 2007; Shultz et al. 2018; Sikora et al. 2019). These fields are typically detected through Zeeman splitting and circular polarisation signatures in spectral lines, observed using high- or medium-resolution spectropolarimetric techniques (e.g. Bagnulo et al. 2015; Mathys 2017; Chojnowski et al. 2019). The rotational modulation of spectral line profiles and polarisation signatures enables the determination of detailed surface field geometries. This can be achieved either by fitting integral magnetic observables, such as the longitudinal magnetic field ⟨Bz⟩ and the field modulus ⟨B⟩, using simple parameterised field topology models (Landstreet & Mathys 2000; Bagnulo et al. 2002) or by reconstructing detailed maps of the surface field and associated chemical star spots using the full Stokes parameter profile information with the Zeeman Doppler imaging (ZDI) inversion technique (Kochukhov 2016).
The application of these different magnetic field modelling methodologies reveals a complex and nuanced picture. It is well known that the sinusoidal rotational ⟨Bz⟩ curves of early-type stars can be successfully described by simple dipolar geometries, leading to the conclusion that such field configurations dominate in most known cases (e.g. Aurière et al. 2007; Sikora et al. 2019). However, interpreting the rotational variation in multiple magnetic observables or reproducing non-sinusoidal ⟨Bz⟩ curves necessitates the introduction of more complex magnetic topologies, prompting claims of ubiquitous contributions of quadrupolar field components (e.g. Landstreet 1990; Landstreet & Mathys 2000; Bagnulo et al. 2002).
Zeeman Doppler imaging analyses, in particular, have demonstrated common departures from simple dipolar field topologies, revealing that most stars exhibit distortions, asymmetries, and smaller-scale structures superimposed on the basic dipolar configuration (Kochukhov et al. 2004, 2019, 2022, 2023; Kochukhov & Wade 2010; Silvester et al. 2014). At the same time, ZDI studies have failed to confirm the presence of quadrupole-dominated fields in early-type stars, instead finding asymmetric dipolar structures even in stars with distinctly non-sinusoidal ⟨Bz⟩ curves (Silvester et al. 2015; Kochukhov et al. 2017; Rusomarov et al. 2018; Semenko et al. 2024). Two early-B magnetic stars, HD 37776 (Kochukhov et al. 2011) and τ Sco (Donati et al. 2006; Kochukhov & Wade 2016), stand out as notable exceptions, exhibiting highly complex surface magnetic fields dominated by harmonic components with ℓ ≥ 3. Understanding this diversity of field geometries is crucial for refining theories of stellar magnetism and its role in stellar evolution.
In this discussion, the late-B star HD 57372 emerges as a particularly intriguing object for studying deviations from a simple dipolar magnetic field geometry. This relatively faint chemically peculiar star, classified as B8p Si by Renson & Manfroid (2009), has frequently been the subject of photometric variability studies (Bernhard et al. 2015; Netopil et al. 2017; Jagelka et al. 2019), which have documented its high-amplitude, double-wave variation over a 7.889-day rotational period. Hubrig et al. (2024, hereafter H24) conducted the first spectroscopic and spectropolarimetric analysis of HD 57372, reporting the detection of Zeeman-split lines in medium-resolution near-infrared Apache Point Observatory Galactic Evolution Experiment (APOGEE) spectra as well as in high-resolution optical High Accuracy Radial Velocity Planet Searcher (HARPS) observations. These observations revealed a magnetic field modulus reaching up to 15.6 kG, with strong variations over the rotational cycle. H24 also measured the longitudinal magnetic field changing between −6 and 1.7 kG.
Notably, HD 57372 exhibits an exceptionally large modulation in its mean field modulus, with a staggering 10 kG difference between extrema in its ⟨B⟩ phase curve, as determined by H24 from Gaussian fits to the resolved components of several Zeeman-split spectral lines. This variation, corresponding to ⟨B⟩max/⟨B⟩min ≈ 3, significantly exceeds the expected factor of ≤1.25 for a centred dipolar field (Kochukhov 2024). Consequently, H24 speculated that HD 57372 possesses a very unusual magnetic field geometry. However, no quantitative magnetic field model was proposed in their study, and an attempt to derive dipolar field parameters using conventional formulas yielded no useful results.
The goal of the present work is to construct a detailed model of the magnetic field geometry of HD 57372 based on high-resolution spectropolarimetric observations obtained by H24. Through this analysis, we aim to characterise the star’s surface magnetic field, assess the validity of claims regarding its complexity, and place it within the broader context of field geometry studies of early-type stars.
2. Archival spectropolarimetric observations
Eight observations of HD 57372 were obtained with the HARPS spectrograph (Mayor et al. 2003) at the European Southern Observatory (ESO) 3.6 m telescope between 23 April and 1 May 2022. The instrument was used in combination with the circular polarimetric unit, HARPSpol (Piskunov et al. 2011), enabling the recording of Stokes I and V spectra with a resolving power of 110 000 and a wavelength coverage from 379 to 691 nm, except for a gap in the 526–534 nm region. A detailed log of these observations can be found in H24.
We retrieved the raw HARPSpol spectra of HD 57372, along with the associated calibration exposures, from the ESO archive1. These data were processed using the REDUCE echelle spectral reduction package (Piskunov & Valenti 2002), following the procedures outlined in our previous publications (e.g. Rusomarov et al. 2013, 2018).
3. Stellar parameters
H24 adopted Teff = 13 500 K and log g = 4.0 in their analysis of HD 57372, providing chemical abundances for 32 ions based on equivalent width fitting while ignoring magnetic field effects. Although these abundances are likely overestimated due to the neglect of magnetic intensification, they serve as a useful starting point for analysing this star. Using this abundance table, we computed a grid of LLMODELS (Shulyak et al. 2004) atmospheres that account for the non-solar chemical composition of the stellar surface layers. The resulting theoretical spectral energy distributions were then compared with the Gaia Data Release 3 (DR3) externally calibrated BP/RP spectrophotometry of HD 57372 (Montegriffo et al. 2023). By adopting E(B − V) = 0.023 ± 0.022 (Lallement et al. 2022), fixing log g = 4.0, and using the Gaia DR3 parallax π = 2.412 ± 0.036 mas, we confirmed Teff = 13 500 ± 500 K and derived a stellar radius of R = 2.18 ± 0.14 R⊙.
To refine the stellar rotational period, we analysed five sectors of Transiting Exoplanet Survey Satellite (TESS, Ricker et al. 2015) photometric observations of HD 57372, spanning from January 2019 (sector 7) to December 2024 (sector 87). The light curves were extracted from the TESS full-frame images using the TESSCUT code (Brasseur et al. 2019) and analysed with the custom time-series analysis tools described in Kochukhov et al. (2021). This yielded a rotational period of Prot = 7.8889898(38) d, approximately 14 s shorter than the value derived by H24 from a subset of TESS data. This discrepancy is negligible for the relative phasing of the HARPSpol spectra. Consequently, for the Stokes profile modelling presented below, we adopted the same rotational ephemeris as H24.
The projected rotational velocity, ve sin i = 13.8 ± 0.5 km s−1, was estimated by fitting theoretical spectra computed with the SYNMAST code (Kochukhov et al. 2010) to the observed profiles of the Fe II 449.140 nm line, which has a low Landé factor (geff = 0.43). By combining information on Prot, R, and ve sin i, we determined the stellar inclination using the Bayesian formalism of Bowler et al. (2023). This analysis yielded  , and we adopted i = 75° for the ZDI inversions presented below.
4. Multi-line polarisation analysis
The magnetic field of HD 57372 is strong compared to that of typical Ap/Bp stars, producing clear Stokes V signatures in many individual spectral lines. However, the available HARPSpol observations of this star are characterised by a relatively low signal-to-noise ratio (S/N) of 90–120. To enhance the data quality and isolate spectropolarimetric signatures of individual species, we applied the least-squares deconvolution (LSD) technique (Kochukhov et al. 2010), which allowed us to obtain high-S/N mean Stokes I and V profiles for several chemical elements.
Using the stellar parameters discussed in Sect. 3 and the abundances from H24, we extracted a tailored atomic line list for HD 57372 from the VALD database (Ryabchikova et al. 2015). We then applied the multi-profile version of LSD, as described by Kochukhov et al. (2010), to different groups of spectral lines. The best results were obtained for the line masks of Cr, Ti, and Fe, which included 199, 251, and 2268 spectral lines, respectively. The resulting LSD profiles, shown in Fig. A.2, were computed with a normalisation wavelength of λ = 500 nm, an effective Landé factor of geff = 1.2, and a line depth of d = 0.4.
5. Zeeman Doppler imaging
The ZDI analysis of HD 57372 was performed using the code and methodology introduced by Kochukhov et al. (2014), which was later refined and applied to various early-type stars in Kochukhov et al. (2017, 2019, 2022, 2023). In summary, we conducted detailed polarised radiative transfer calculations to generate local spectra in all four Stokes parameters across the entire HARPSpol wavelength range, considering different field strengths, field vector orientations, limb angles, and element abundances. The LSD procedure was then applied to these calculations using the same wavelength-dependent weights and line masks as in the observational analysis. The resulting grid of local Stokes I and V LSD profiles was used to generate disk-integrated LSD profiles for the prescribed magnetic and chemical maps. We incorporated this forward model into the INVERSLSD code, which allowed us to derive the magnetic field distribution and chemical abundance maps without the usual simplifying assumptions inherent to LSD-based ZDI analyses (e.g. Morin et al. 2008; Folsom et al. 2018). The inversions were carried out using Ti, Cr, and Fe LSD profiles separately, which yielded three independent surface field maps. In each case, the magnetic field was represented using a general spherical harmonic expansion (Kochukhov et al. 2014), extended to ℓmax = 10.
The average magnetic field map of HD 57372 is presented in Fig. 1, alongside the standard deviation maps. The corresponding individual magnetic field maps are shown in Fig. A.1, while the ZDI fits to the observed Stokes I and V profiles of the three elements are illustrated in Fig. A.2. This analysis consistently reveals a simple bipolar magnetic field distribution for HD 57372, as indicated by the radial field polarity. However, the local field strength deviates significantly from a dipolar geometry. The negative (inward directed) magnetic field region reaches up to 17.8 kG, whereas the positive field region does not exceed 11.6 kG. This field strength asymmetry is counterbalanced by a larger fraction (66%) of the stellar surface being occupied by the positive field. Notably, the strong-field region associated with the negative radial field is dominated by horizontal, predominantly meridional, magnetic fields.
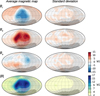 |
Fig. 1. Results of the ZDI analysis of HD 57372. Right column: Magnetic field topology derived by averaging ZDI maps inferred from the Fe, Cr, and Ti LSD profiles. Left column: Corresponding standard deviation maps. The four rows display Hammer-Aitoff projections of the radial, meridional, and azimuthal components of the magnetic field, as well as the field modulus. The grey-scale overlay represents the relative visibility of different surface regions, taking stellar inclination and rotational phase coverage into consideration (Kochukhov et al. 2022). The darkest region is entirely invisible, while lighter shades correspond to relative visibilities of ≤25 and ≤50%. |
As illustrated by the magnetic energy spectrum in Fig. 2, despite its topological peculiarities, the stellar field geometry remains largely dipolar (ℓ = 1 modes containing 75% of the magnetic energy) and poloidal (77% of the energy concentrated in poloidal modes). Thus, the surface field of HD 57372 represents another example of a distorted dipolar configuration, though with more pronounced asymmetries than those typically observed in ZDI studies of early-type stars. However, the magnetic field of HD 57372 clearly does not exhibit the same level of complexity as those of HD 37776 or τ Sco, which are the only known early-type stars with distinctly non-dipolar magnetic field topologies.
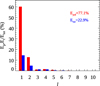 |
Fig. 2. Fractional energies of the poloidal (red) and toroidal (blue) harmonic components as a function of the angular degree, ℓ. |
The standard deviation maps indicate average uncertainties of 0.7–3.6 kG for the three magnetic field vector components and the field modulus. This corresponds to 6–13% of the peak field values in the respective maps. Abundance distributions (not shown here) reconstructed alongside the magnetic field maps reveal relatively little surface variation, with maximum abundance contrasts of just 0.7–1.1 dex, compared to the 2–4 dex often observed for Ap/Bp stars. This suggests that the prominent Stokes I LSD profile variability observed in Fig. A.2 is primarily driven by the magnetic field.
6. Discussion
According to our ZDI results, the global surface-averaged magnetic field strength of HD 57372 is 7.6 kG, with the local field strength ranging from 2.1 to 17.8 kG. The average field geometry model predicts rotational variation in the mean field modulus between 4.4 and 12.8 kG. This is lower than the maximum ⟨B⟩ of 15.6 kG reported by H24. However, their Gaussian-based measurements of Zeeman-split lines may be inaccurate for such a strong-field star.
As an alternative approach to validating the ZDI magnetic field map, we calculated the Stokes I spectra around the Si II 669.943 nm line, which exhibits resolved Zeeman components in half of the HARPSpol observations. We employed the INVERS10 code (Piskunov & Kochukhov 2002) to adjust the Si abundance while keeping the magnetic field map fixed according to the results from Sect. 5. The resulting excellent fit to the observed profiles of this line, shown in Fig. 3, confirms that the ZDI model is consistent with the profiles of Zeeman-split lines in the optical.
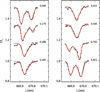 |
Fig. 3. Observed (histograms) and best-fitting ZDI model (solid lines) intensity profiles of the Si II 669.943 nm spectral line. Observations corresponding to different nights are offset vertically, with the rotational phases indicated to the right of each spectrum. |
Extension of this analysis to the H band, modelling some of the lines with resolved Zeeman components identified in this region by H24, would be particularly interesting. However, such an analysis requires near-infrared observational data of higher quality than the medium-resolution APOGEE spectra with a sparse phase coverage currently available for this star.
Considering our results in the broader context of magnetism studies of early-type stars, the field structure of HD 57372 represents an intriguing example of a rare, strongly asymmetric bipolar configuration. This structure exhibits an extreme contrast between the two poles while retaining the fundamental field orientation pattern of a dipolar geometry. Thus, stars with a large ratio of maximum to minimum ⟨B⟩, similar to HD 57372, may harbour such asymmetric dipoles rather than field geometries with significant quadrupolar or higher-order contributions.
Comparing the findings of this study with previous ZDI analyses of Ap/Bp stars, we conclude that the field structure of HD 57372 is not entirely unique but shares some similarities with the magnetic field topology of the Bp star HD 133880 (HR 5624), studied by Kochukhov et al. (2017). The magnetic field geometries of these two stars are compared side by side, along with a perpendicular dipolar field, in Fig. B.1. Both stars exhibit a compact, strong negative field region and a larger, less well-defined positive field that is not associated with any extremum in the field modulus map. Notably, these similar field topologies emerge from two distinct ZDI studies. Unlike HD 57372, HD 133880 rotates very rapidly, providing exceptional Doppler resolution of its surface, and was studied with an extensive dataset comprising over 50 Stokes V spectra. The consistency of these ZDI results obtained under different conditions is an argument against interpreting the asymmetric dipolar geometry as an inversion artefact. Instead, this structure appears to be a genuine feature of the magnetic topology in some late-B magnetic stars and is likely more common than, for example, quadrupole-dominated fields, for which no confirmed examples currently exist. We emphasise the importance of considering these asymmetric bipolar topologies in empirical modelling of magnetic observables, ranging from integral quantitates, such as ⟨Bz⟩ and ⟨B⟩, to Stokes parameter profiles. At the same time, theoretical studies of magnetism in early-type stars should also address the existence and implications of these magnetic geometries.
Acknowledgments
The author acknowledges support by the Swedish Research Council (grant agreement no. 2023-03667) and the Swedish National Space Agency.
References
- Aurière, M., Wade, G. A., Silvester, J., et al. 2007, A&A, 475, 1053 [NASA ADS] [CrossRef] [EDP Sciences] [Google Scholar]
- Bagnulo, S., Landi Degl’Innocenti, M., Landolfi, M., & Mathys, G. 2002, A&A, 394, 1023 [NASA ADS] [CrossRef] [EDP Sciences] [Google Scholar]
- Bagnulo, S., Fossati, L., Landstreet, J. D., & Izzo, C. 2015, A&A, 583, A115 [NASA ADS] [CrossRef] [EDP Sciences] [Google Scholar]
- Bernhard, K., Hümmerich, S., Otero, S., & Paunzen, E. 2015, A&A, 581, A138 [NASA ADS] [CrossRef] [EDP Sciences] [Google Scholar]
- Bowler, B. P., Tran, Q. H., Zhang, Z., et al. 2023, AJ, 165, 164 [NASA ADS] [CrossRef] [Google Scholar]
- Braithwaite, J., & Spruit, H. C. 2004, Nature, 431, 819 [Google Scholar]
- Brasseur, C. E., Phillip, C., Fleming, S. W., Mullally, S. E., & White, R. L. 2019, Astrophysics Source Code Library [record ascl:1905.007] [Google Scholar]
- Chojnowski, S. D., Hubrig, S., Hasselquist, S., et al. 2019, ApJ, 873, L5 [NASA ADS] [CrossRef] [Google Scholar]
- Donati, J.-F., & Landstreet, J. D. 2009, ARA&A, 47, 333 [NASA ADS] [CrossRef] [Google Scholar]
- Donati, J. F., Howarth, I. D., Jardine, M. M., et al. 2006, MNRAS, 370, 629 [NASA ADS] [CrossRef] [Google Scholar]
- Folsom, C. P., Bouvier, J., Petit, P., et al. 2018, MNRAS, 474, 4956 [NASA ADS] [CrossRef] [Google Scholar]
- Grunhut, J. H., Wade, G. A., Neiner, C., et al. 2017, MNRAS, 465, 2432 [NASA ADS] [CrossRef] [Google Scholar]
- Hubrig, S., Chojnowski, S. D., Järvinen, S. P., Ilyin, I., & Pan, K. 2024, A&A, 687, A282 [NASA ADS] [CrossRef] [EDP Sciences] [Google Scholar]
- Jagelka, M., Mikulášek, Z., Hümmerich, S., & Paunzen, E. 2019, A&A, 622, A199 [NASA ADS] [CrossRef] [EDP Sciences] [Google Scholar]
- Keszthelyi, Z. 2023, Galaxies, 11, 40 [NASA ADS] [CrossRef] [Google Scholar]
- Kochukhov, O. 2016, in Lecture Notes in Physics, J.-P. Rozelot, & C. Neiner (Berlin: Springer Verlag), 914, 177 [Google Scholar]
- Kochukhov, O. 2024, A&A, 686, A189 [NASA ADS] [CrossRef] [EDP Sciences] [Google Scholar]
- Kochukhov, O., & Wade, G. A. 2010, A&A, 513, A13 [NASA ADS] [CrossRef] [EDP Sciences] [Google Scholar]
- Kochukhov, O., & Wade, G. A. 2016, A&A, 586, A30 [NASA ADS] [CrossRef] [EDP Sciences] [Google Scholar]
- Kochukhov, O., Bagnulo, S., Wade, G. A., et al. 2004, A&A, 414, 613 [NASA ADS] [CrossRef] [EDP Sciences] [Google Scholar]
- Kochukhov, O., Makaganiuk, V., & Piskunov, N. 2010, A&A, 524, A5 [NASA ADS] [CrossRef] [EDP Sciences] [Google Scholar]
- Kochukhov, O., Lundin, A., Romanyuk, I., & Kudryavtsev, D. 2011, ApJ, 726, 24 [NASA ADS] [CrossRef] [Google Scholar]
- Kochukhov, O., Lüftinger, T., Neiner, C., Alecian, E., & MiMeS Collaboration 2014, A&A, 565, A83 [NASA ADS] [CrossRef] [EDP Sciences] [Google Scholar]
- Kochukhov, O., Silvester, J., Bailey, J. D., Landstreet, J. D., & Wade, G. A. 2017, A&A, 605, A13 [NASA ADS] [CrossRef] [EDP Sciences] [Google Scholar]
- Kochukhov, O., Shultz, M., & Neiner, C. 2019, A&A, 621, A47 [NASA ADS] [CrossRef] [EDP Sciences] [Google Scholar]
- Kochukhov, O., Khalack, V., Kobzar, O., et al. 2021, MNRAS, 506, 5328 [NASA ADS] [CrossRef] [Google Scholar]
- Kochukhov, O., Papakonstantinou, N., & Neiner, C. 2022, MNRAS, 510, 5821 [NASA ADS] [CrossRef] [Google Scholar]
- Kochukhov, O., Gürsoytrak Mutlay, H., Amarsi, A. M., et al. 2023, MNRAS, 521, 3480 [NASA ADS] [CrossRef] [Google Scholar]
- Lallement, R., Vergely, J. L., Babusiaux, C., & Cox, N. L. J. 2022, A&A, 661, A147 [NASA ADS] [CrossRef] [EDP Sciences] [Google Scholar]
- Landstreet, J. D. 1990, ApJ, 352, L5 [Google Scholar]
- Landstreet, J. D., & Mathys, G. 2000, A&A, 359, 213 [NASA ADS] [Google Scholar]
- Mathys, G. 2017, A&A, 601, A14 [NASA ADS] [CrossRef] [EDP Sciences] [Google Scholar]
- Mayor, M., Pepe, F., Queloz, D., et al. 2003, The Messenger, 114, 20 [NASA ADS] [Google Scholar]
- Montegriffo, P., De Angeli, F., Andrae, R., et al. 2023, A&A, 674, A3 [NASA ADS] [CrossRef] [EDP Sciences] [Google Scholar]
- Morel, T., Castro, N., Fossati, L., et al. 2015, in New Windows on Massive Stars, eds. G. Meynet, C. Georgy, J. Groh, & P. Stee, IAU Symposium, 307, 342 [Google Scholar]
- Morin, J., Donati, J. F., Petit, P., et al. 2008, MNRAS, 390, 567 [Google Scholar]
- Netopil, M., Paunzen, E., Hümmerich, S., & Bernhard, K. 2017, MNRAS, 468, 2745 [NASA ADS] [CrossRef] [Google Scholar]
- Petit, V., Owocki, S. P., Wade, G. A., et al. 2013, MNRAS, 429, 398 [NASA ADS] [CrossRef] [Google Scholar]
- Piskunov, N., & Kochukhov, O. 2002, A&A, 381, 736 [NASA ADS] [CrossRef] [EDP Sciences] [Google Scholar]
- Piskunov, N. E., & Valenti, J. A. 2002, A&A, 385, 1095 [NASA ADS] [CrossRef] [EDP Sciences] [Google Scholar]
- Piskunov, N., Snik, F., Dolgopolov, A., et al. 2011, The Messenger, 143, 7 [NASA ADS] [Google Scholar]
- Renson, P., & Manfroid, J. 2009, A&A, 498, 961 [NASA ADS] [CrossRef] [EDP Sciences] [Google Scholar]
- Ricker, G. R., Winn, J. N., Vanderspek, R., et al. 2015, Journal of Astronomical Telescopes, Instruments, and Systems, 1, 014003 [Google Scholar]
- Rusomarov, N., Kochukhov, O., Piskunov, N., et al. 2013, A&A, 558, A8 [NASA ADS] [CrossRef] [EDP Sciences] [Google Scholar]
- Rusomarov, N., Kochukhov, O., & Lundin, A. 2018, A&A, 609, A88 [NASA ADS] [CrossRef] [EDP Sciences] [Google Scholar]
- Ryabchikova, T., Piskunov, N., Kurucz, R. L., et al. 2015, Phys. Scr., 90, 054005 [Google Scholar]
- Schneider, F. R. N., Ohlmann, S. T., Podsiadlowski, P., et al. 2019, Nature, 574, 211 [Google Scholar]
- Semenko, E., Kochukhov, O., Mikulášek, Z., et al. 2024, MNRAS, 535, 2812 [Google Scholar]
- Shultz, M. E., Wade, G. A., Rivinius, T., et al. 2018, MNRAS, 475, 5144 [NASA ADS] [Google Scholar]
- Shulyak, D., Tsymbal, V., Ryabchikova, T., Stütz, C., & Weiss, W. W. 2004, A&A, 428, 993 [NASA ADS] [CrossRef] [EDP Sciences] [Google Scholar]
- Sikora, J., Wade, G. A., Power, J., & Neiner, C. 2019, MNRAS, 483, 3127 [NASA ADS] [CrossRef] [Google Scholar]
- Silvester, J., Kochukhov, O., & Wade, G. A. 2014, MNRAS, 440, 182 [NASA ADS] [CrossRef] [Google Scholar]
- Silvester, J., Kochukhov, O., & Wade, G. A. 2015, MNRAS, 453, 2163 [NASA ADS] [CrossRef] [Google Scholar]
- Wade, G. A., Neiner, C., Alecian, E., et al. 2016, MNRAS, 456, 2 [Google Scholar]
Appendix A: ZDI results for individual chemical elements
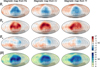 |
Fig. A.1. Same as Fig. 1 but for the individual magnetic field maps of HD 57372 reconstructed from the Fe, Cr, and Ti LSD profiles. |
 |
Fig. A.2. Comparison of the observed (symbols) and best-fitting ZDI model (solid lines) LSD Stokes I and V profiles of HD 57372. The figure shows three pairs of profiles, for Fe, Cr, and Ti. For each pair, the left panel corresponds to Stokes I and the right to Stokes V. The data for different observing nights are offset vertically, with the rotational phases indicated next to each Stokes I profile. |
Appendix B: Comparison of HD 57372 and HD 133880
 |
Fig. B.1. Same as Fig. 1 but for the radial field component and the field modulus of HD 57372 (left column) compared to the ZDI results for HD 133880 (middle column) from Kochukhov et al. (2017). For reference, the right column shows magnetic maps for a centred dipolar field with a polar strength of Bd = 11 kG and an obliquity of β = 90°. |
All Figures
|
Fig. 1. Results of the ZDI analysis of HD 57372. Right column: Magnetic field topology derived by averaging ZDI maps inferred from the Fe, Cr, and Ti LSD profiles. Left column: Corresponding standard deviation maps. The four rows display Hammer-Aitoff projections of the radial, meridional, and azimuthal components of the magnetic field, as well as the field modulus. The grey-scale overlay represents the relative visibility of different surface regions, taking stellar inclination and rotational phase coverage into consideration (Kochukhov et al. 2022). The darkest region is entirely invisible, while lighter shades correspond to relative visibilities of ≤25 and ≤50%. |
| In the text | |
|
Fig. 2. Fractional energies of the poloidal (red) and toroidal (blue) harmonic components as a function of the angular degree, ℓ. |
| In the text | |
|
Fig. 3. Observed (histograms) and best-fitting ZDI model (solid lines) intensity profiles of the Si II 669.943 nm spectral line. Observations corresponding to different nights are offset vertically, with the rotational phases indicated to the right of each spectrum. |
| In the text | |
|
Fig. A.1. Same as Fig. 1 but for the individual magnetic field maps of HD 57372 reconstructed from the Fe, Cr, and Ti LSD profiles. |
| In the text | |
|
Fig. A.2. Comparison of the observed (symbols) and best-fitting ZDI model (solid lines) LSD Stokes I and V profiles of HD 57372. The figure shows three pairs of profiles, for Fe, Cr, and Ti. For each pair, the left panel corresponds to Stokes I and the right to Stokes V. The data for different observing nights are offset vertically, with the rotational phases indicated next to each Stokes I profile. |
| In the text | |
|
Fig. B.1. Same as Fig. 1 but for the radial field component and the field modulus of HD 57372 (left column) compared to the ZDI results for HD 133880 (middle column) from Kochukhov et al. (2017). For reference, the right column shows magnetic maps for a centred dipolar field with a polar strength of Bd = 11 kG and an obliquity of β = 90°. |
| In the text | |
Current usage metrics show cumulative count of Article Views (full-text article views including HTML views, PDF and ePub downloads, according to the available data) and Abstracts Views on Vision4Press platform.
Data correspond to usage on the plateform after 2015. The current usage metrics is available 48-96 hours after online publication and is updated daily on week days.
Initial download of the metrics may take a while.