Fig. 1.
Download original image
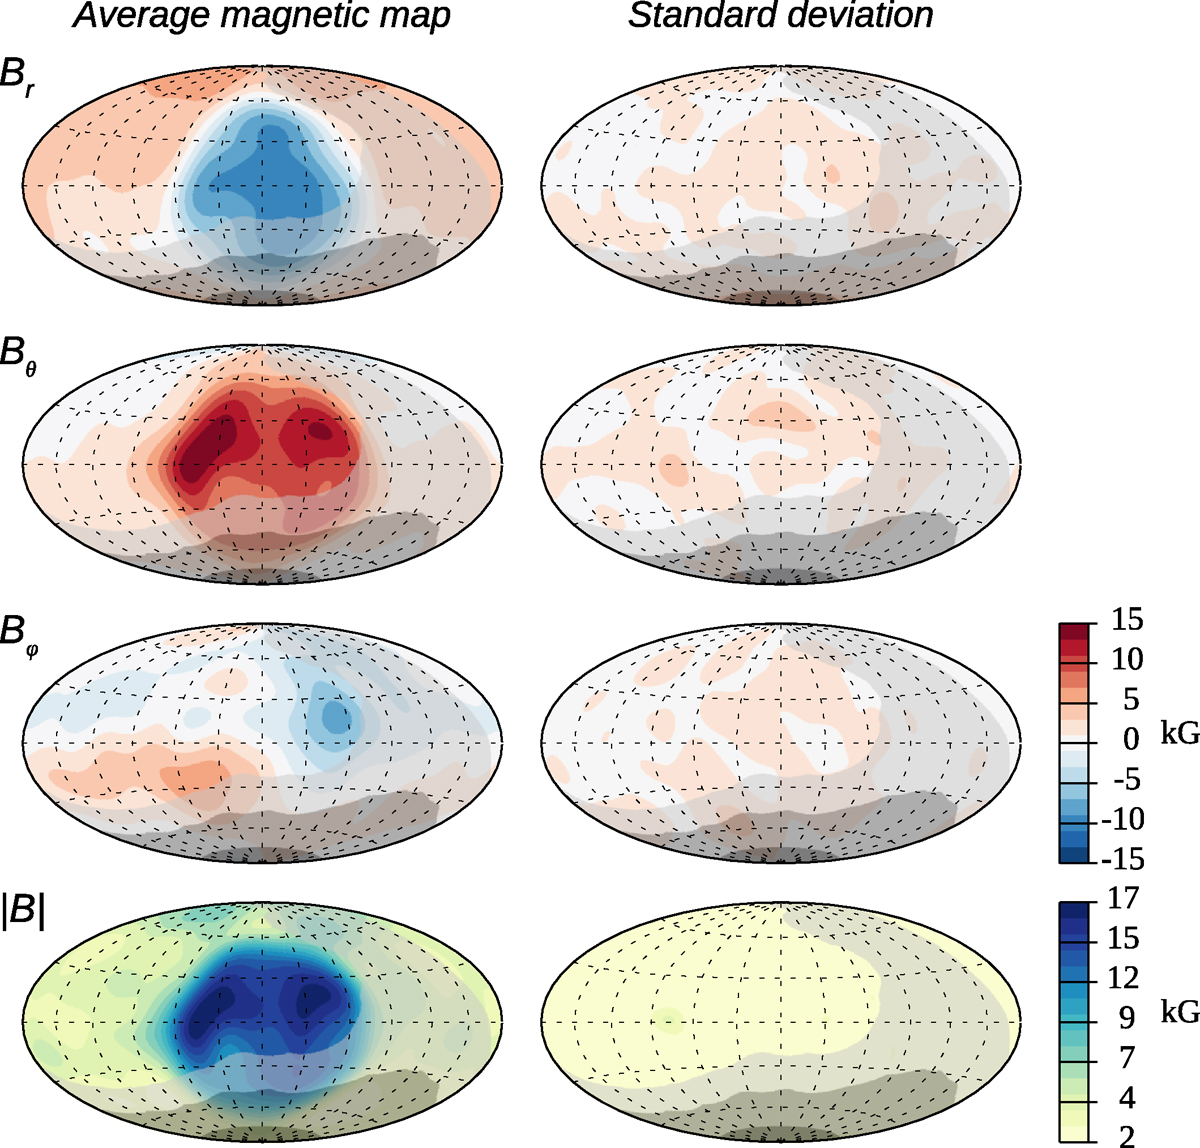
Results of the ZDI analysis of HD 57372. Right column: Magnetic field topology derived by averaging ZDI maps inferred from the Fe, Cr, and Ti LSD profiles. Left column: Corresponding standard deviation maps. The four rows display Hammer-Aitoff projections of the radial, meridional, and azimuthal components of the magnetic field, as well as the field modulus. The grey-scale overlay represents the relative visibility of different surface regions, taking stellar inclination and rotational phase coverage into consideration (Kochukhov et al. 2022). The darkest region is entirely invisible, while lighter shades correspond to relative visibilities of ≤25 and ≤50%.
Current usage metrics show cumulative count of Article Views (full-text article views including HTML views, PDF and ePub downloads, according to the available data) and Abstracts Views on Vision4Press platform.
Data correspond to usage on the plateform after 2015. The current usage metrics is available 48-96 hours after online publication and is updated daily on week days.
Initial download of the metrics may take a while.