Open Access
Fig. 3.
Download original image
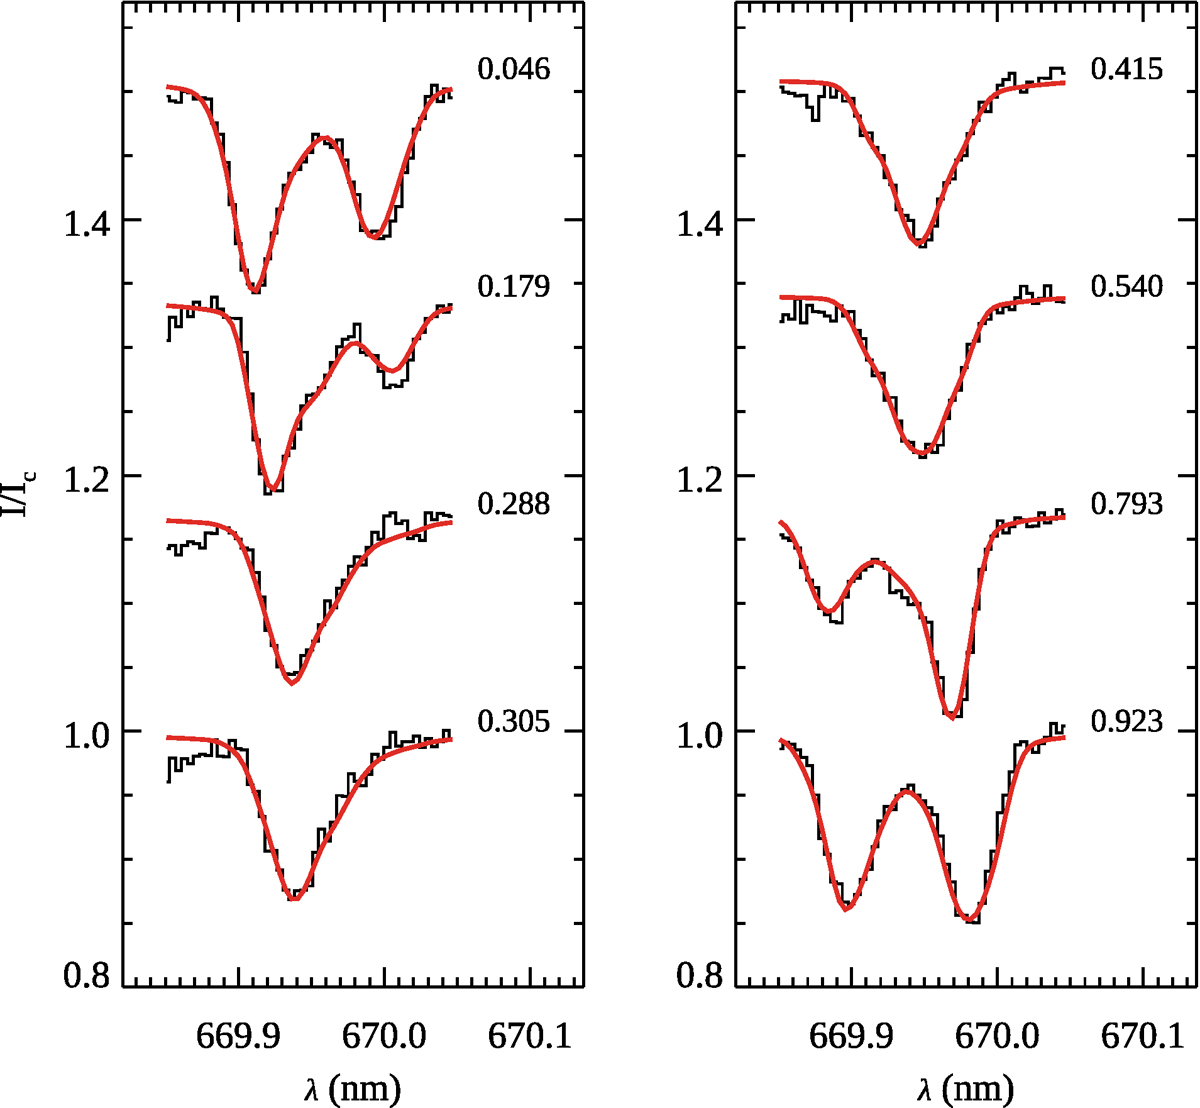
Observed (histograms) and best-fitting ZDI model (solid lines) intensity profiles of the Si II 669.943 nm spectral line. Observations corresponding to different nights are offset vertically, with the rotational phases indicated to the right of each spectrum.
Current usage metrics show cumulative count of Article Views (full-text article views including HTML views, PDF and ePub downloads, according to the available data) and Abstracts Views on Vision4Press platform.
Data correspond to usage on the plateform after 2015. The current usage metrics is available 48-96 hours after online publication and is updated daily on week days.
Initial download of the metrics may take a while.