Fig. 1.
Download original image
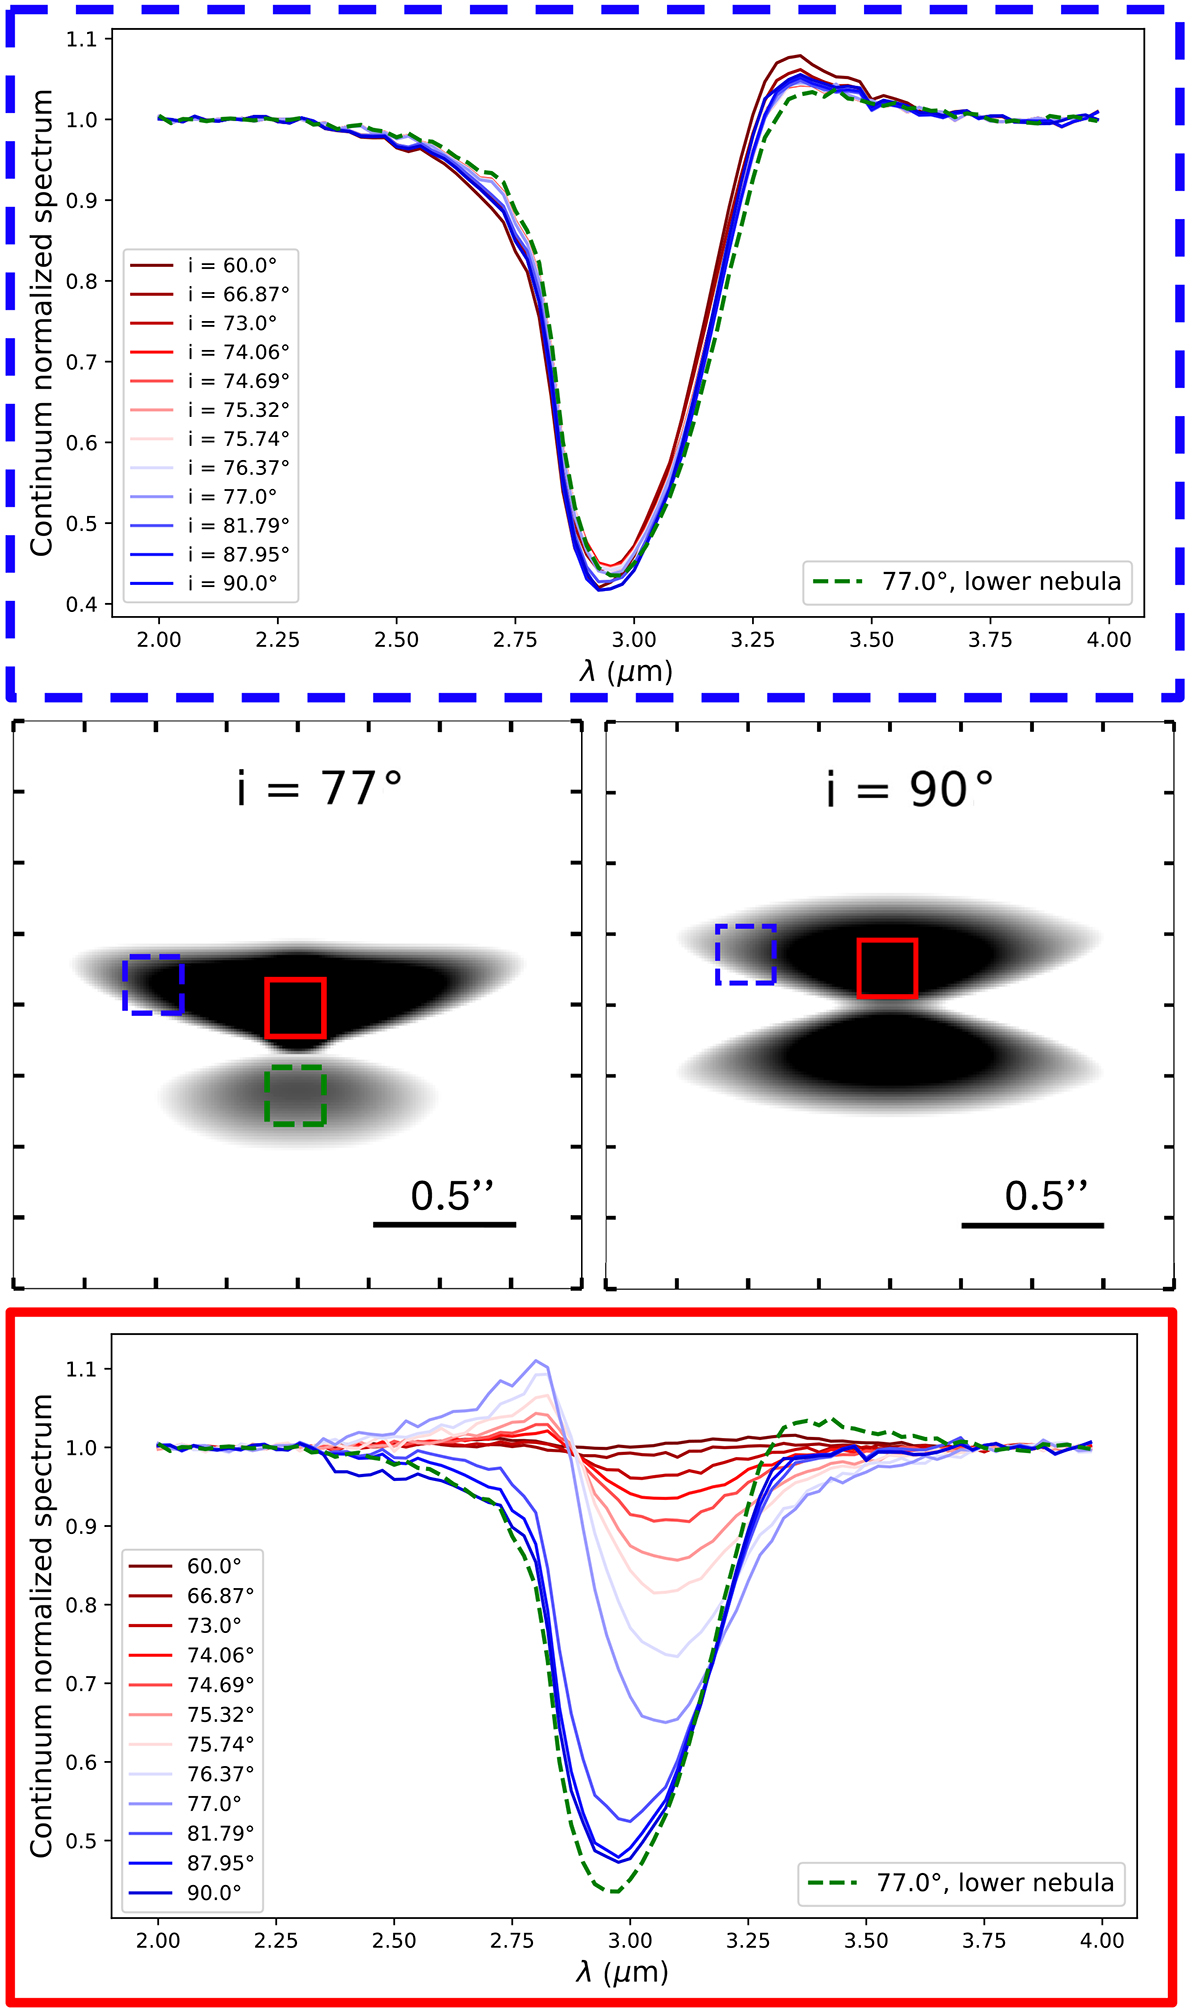
Synthetic spectra (top and bottom panels) and scattered-light images (middle panels) of our generic model at two different inclinations (grazing angle and edge-on). Images at 3.0 μm are shown with a logarithmic color scale. The squares correspond to the extraction zones in the edge of the disk (dashed blue line) and in the central point source (solid red line) with the associated spectra at different inclinations (between 60°and 90°). A spectrum of the lower nebula in the grazing-angle geometry is shown with a dashed green line in the top and bottom panels.
Current usage metrics show cumulative count of Article Views (full-text article views including HTML views, PDF and ePub downloads, according to the available data) and Abstracts Views on Vision4Press platform.
Data correspond to usage on the plateform after 2015. The current usage metrics is available 48-96 hours after online publication and is updated daily on week days.
Initial download of the metrics may take a while.