| Issue |
A&A
Volume 696, April 2025
|
|
|---|---|---|
| Article Number | L11 | |
| Number of page(s) | 6 | |
| Section | Letters to the Editor | |
| DOI | https://doi.org/10.1051/0004-6361/202554239 | |
| Published online | 08 April 2025 | |
Letter to the Editor
A possible GeV-TeV connection in the direction of the globular cluster UKS 1
1
Department of Earth, Environmental & Space Sciences, Chungnam National University, Daejeon 34134, Republic of Korea
2
Department of Astronomy and Space Science, Chungnam National University, Daejeon 34134, Republic of Korea
3
Department of Physics and Astronomy, Michigan State University, East Lansing, MI 48824, USA
4
Astrophysical Big Bang Laboratory (ABBL), RIKEN Cluster for Pioneering Research, Wakō, Saitama 351-0198, Japan
5
Theoretical Astrophysics, Department of Earth and Space Science, Graduate School of Science, Osaka University, Toyonaka, Osaka 560-0043, Japan
⋆ Corresponding author; This email address is being protected from spambots. You need JavaScript enabled to view it.
, This email address is being protected from spambots. You need JavaScript enabled to view it.
Received:
24
February
2025
Accepted:
24
March
2025
Abstract
Aims. Using public data collected by the Fermi Large Area Telescope (LAT) over 16 years and the 1523 days of survey data (3HWC) from the High Altitude Water Cherenkov (HAWC) observatory, we searched for possible GeV-TeV connections in globular clusters (GCs).
Methods. Excluding 44 confirmed γ-ray detections of GCs in the latest Fourth Fermi-LAT point source catalog (4FGL-DR4), we searched for possible GeV emission from the other 113 known GCs based on 16 years of LAT data. We performed a systematic binned likelihood analysis in the energy range of 0.3–100 GeV toward these targets. We also searched for possible TeV excesses in the directions of 27 GeV-detected GCs covered by the 3HWC survey area, assuming a point-source morphology and a power-law spectrum of E−2.5.
Results. In addition to the confirmed γ-ray GCs in the 4FGL catalog, we report a GeV detection at the position of UKS 1 with a post-trial probability of ∼8 × 10⁻⁵ of it proving to be a fluctuation. Its spectrum within this energy range is well described by a power-law model with Γ ≃ 2.3 ± 0.5. Furthermore, this GeV feature appears to extend southeast in a direction toward the Galactic plane. From the 3HWC survey data, we have also identified a TeV feature in the direction of UKS 1. It is well resolved from any known very-high-energy (VHE) source. The post-trial probability that this feature is a fluctuation is ∼3 × 10⁻⁴. If confirmed, this would mark the second detection of a TeV feature in the proximity of a GC. While the GeV emission mostly coincides with the center of UKS 1, the TeV peak is displaced from the cluster center by several tidal radii in the trailing direction of the GC’s proper motion. Given the supersonic speed of UKS 1 at ∼270 km s−1, our findings are consistent with a scenario where the VHE γ-rays are produced by inverse Compton scattering between relativistic particles and ambient soft photon fields during the course of their propagation away from the head of the bow shock.
Key words: pulsars: general / ISM: general / globular clusters: general / gamma rays: general
© The Authors 2025
 Open Access article, published by EDP Sciences, under the terms of the Creative Commons Attribution License (https://creativecommons.org/licenses/by/4.0), which permits unrestricted use, distribution, and reproduction in any medium, provided the original work is properly cited.
This article is published in open access under the Subscribe to Open model. This email address is being protected from spambots. You need JavaScript enabled to view it. to support open access publication.
1. Introduction
Shortly after the Fermi Large Area Telescope (LAT) commenced operations, γ-ray emission from the globular cluster (GC) 47 Tuc was detected (Abdo et al. 2009a). Subsequently, a number of other γ-ray GCs were soon revealed, establishing them as a unique source class in the γ-ray sky (e.g., Abdo et al. 2010; Tam et al. 2011). This includes Terzan 5, which hosts the largest known population of millisecond pulsars (MSPs; Kong et al. 2010) that are considered to be the origin of the γ-ray emission.
The γ-ray spectra of most GCs resemble those of MSPs, which can be phenomenologically characterized by a power-law model with an exponential cutoff (PLEC; e.g., Abdo et al. 2010. Except for a few cases where individual luminous MSPs dominate the emission from a GC (Freire et al. 2011; Wu et al. 2013; Zhang et al. 2022, 2023), the γ-rays from GCs are likely to be a collective contribution from the whole MSP population residing within the cluster. This is supported by reported correlations between γ-ray luminosity of GCs, Lγ, and the primary stellar encounter rate within their cores, ΓGC, which resembles the correlation between the MSP population and ΓGC (e.g., Hui et al. 2010, 2011; Abdo et al. 2010). However, a recent study does not find a significant correlation between Lγ and ΓGC (Henry et al. 2024), which indicates the relation between MSPs and Lγ may be more complex.
Also, γ-rays can be produced through inverse Compton scattering (ICS) between relativistic leptons in the pulsar wind and ambient soft photon fields (e.g., Cheng et al. 2010). The ICS scenario is supported by a possible correlation between GC Lγ and their in situ soft photon energy densities (Hui et al. 2011; Henry et al. 2024; Song et al. 2021), as well as evidence of a power-law tail (PL), in addition to the PLEC component of their γ-ray spectra (Song et al. 2021).
The ICS between pulsar wind and soft photons is also expected to produce very-high-energy (VHE > 0.1 TeV) photons (e.g., Cheng et al. 2010). However, the TeV feature found in the direction of Terzan 5 remains the only confirmed detection of such emission (H. E. S. S. Collaboration 2011). Moreover, an offset between the TeV emission peak and the center of the cluster has cast doubt on its physical association.
Theoretical studies have attempted to explain how a GC can produce misaligned TeV features. Bednarek & Sobczak (2014) proposed a scenario involving a GC with a characteristic space velocity of order ∼100 km s−1 forms a bow shock nebula around a GC, where the mixture of stellar and pulsar winds leaving the GC interacts with the surrounding interstellar medium. For a GC located close to the Galactic plane, such as Terzan 5, a nebula with an asymmetric morphology is expected from the formation of a bow shock ahead of the GC’s motion in the dense surrounding medium. Particle advection in the relativistic wind opposite to the direction of the GC’s motion then produces a misalignment between the TeV feature and the GC center.
This does not explain why the peak of the TeV emission does not coincide with the acceleration site of the particles driving the ICS emission. The peak energy density of the accelerated particles should be located at the wind termination shock. There, the starlight from the GC produces a strong ambient photon field capable of forming an ICS TeV peak. However, the relativistic particles emanating from the bow shock are expected to be strongly oriented along the trailing magnetotail, with anisotropic ICS emission directed along their propagation vector. Self-scattering leads to a gradual broadening of the particle pitch angle distribution, isotropizing their emission and allowing it to become visible some distance away from the acceleration site (Krumholz et al. 2024). In this sense, such systems can be used to constrain the scattering processes of cosmic rays in the Milky Way.
In this study, we aim to search for a possible GeV-TeV connection in the directions of GCs in Milky Way by using the data obtained by Fermi-LAT and from a high-sensitivity survey of the northern VHE sky conducted at the High Altitude Water Cherenkov (HAWC) observatory.
2. Data analysis and results
2.1. Searching for additional GeV-detected GC with Fermi-LAT data
Excluding the 44 confirmed GeV-detected GCs in the most updated Fourth Fermi-LAT point source catalog (Ballet et al. 2023, 4FGL-DR4), namely, 41 with positional coincidence plus 3 with confirmed γ-ray pulsations, we have searched for possible γ-rays from the other 113 listed by Harris (1996, 2010 edition).
In this work, we used Fermi-LAT data collected from 2008-08-04 to 2024-06-23, covering ∼16 years. The Fermitools-2.2.0 package1 was used for data reduction and analysis. To search for γ-rays from the target GCs, we selected the events from a region of interest (ROI) within a 10° radius from of the GC locations given by Harris (1996, 2010 edition). Following the standard Fermi-LAT data analysis thread, only the events classified as a “source” (evclass = 128) and event type “FRONT+BACK” (evtype = 3) were included. Since photons coming from the Earth limb can produce a strong background, we can minimize their possible contamination by applying a zenith angle cut of < 90°. To further assess the data quality and to select good time intervals (GTIs), we filter the data with the expressions (DATA_QUAL > 0) && (LAT_CONFIG = 1). Throughout this study, the instrument response function (IRF) P8R3_SOURCE_V3 was used. All the analyses were performed in the energy range of 0.3–100 GeV.
Using the Fermitools task gtlike, we performed a binned maximum likelihood analysis for the data around each target GC. To model all the point and extended sources in 4FGL-DR4 catalog within the corresponding ROI of the target, we adopted their spectral parameters given in the catalog as initial values. For 4FGL sources within 5° from the center of the ROI, we thawed their spectral parameters for fitting. For the other 4FGL sources, their parameters were fixed in the analysis. In view of accounting for the wide point spread function of LAT, particularly at low energies, we also included the 4FGL sources in an extra 10° annular region outside the ROI in the likelihood analysis. Apart from the resolved 4FGL sources, we have also modeled the Galactic diffuse background (gll_iem_v07.fits) and the extragalactic isotropic background (iso_P8R3_SOURCE_V3_v1.txt; Abdo et al. 2009b). For all the targeted GCs, we assume that they are point-sources with a PL spectrum.
We set the detection threshold at 4σ and require the target to be well resolved from its surroundings. Among the 116 GCs we analyzed, only UKS 1 satisfied our detection criteria. With the aforementioned model, our likelihood analysis yields a test statistic (TS) of 37 (see Sect. 3 in Mattox et al. 1996, for the definition of TS). Taking the number of GCs we have searched as the trial factor (i.e., 113), the observed TS value corresponds to a post-trial probability of ∼10−6 that the feature is a background fluctuation. The best-fit PL model has a photon index of Γ = 2.50 ± 0.50. In contrast, a PLEC fit yields a lower TS value of 29.3. While the photon index of the best-fit PLEC model is comparable to that of the PL model (Γ = 2.24 ± 0.21), the cut-off energy Ec = 3.0 ± 6.5 GeV cannot be constrained properly. These results suggest that the PLEC model cannot provide an adequate description of the data.
To examine the surroundings, we have computed the TS map centered on UKS 1 with the Fermitools task gttsmap. A 2 ° ×2° TS map is shown in the left panel of Fig. 1. A γ-ray excess at the location of the GC is clear. This confirms the findings first reported by Yuan et al. (2022) at a significance of ∼4σ. Examination of the TS map suggests that the γ-rays associated with UKS 1 appears to be extended toward the southeast by ∼0.5° with a somewhat lower TS value.
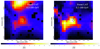 |
Fig. 1. Left panel: TS map of the 2 ° ×2° region centered on UKS 1 with the best-fit diffuse background and contributions from the 4FGL sources subtracted. The black circle represents the tidal radius (3.2′) of UKS 1 at a distance of 15.6 kpc (Fernández-Trincado et al. 2020). The colour scale shows the TS value of every bin of 0.1 ° ×0.1°. Right panel: Same as the left panel, but with three additional sources further subtracted (see Appendix A). |
Besides UKS 1, we have also identified several γ-ray excesses with the ROI (see Appendix A). With these excesses further subtracted, the TS value at the center of UKS 1 goes down to 28.4 for the PL model, which corresponds to a post-trial probability 7.7 × 10⁻⁵ as a fluctuation. In the right panel of Fig. 1, we show the TS map with the aforementioned excesses subtracted. It clearly shows the feature associated with UKS 1 extends toward southeast. Its spectral energy distribution (SED) is shown in Fig. 2. The blue dashed-line represents the best-fit PL spectrum with a photon index of Γ = 2.34 ± 0.50. Integrating the model between 0.3–100 GeV yields an energy flux of  erg cm−2 s−1. At the distance of UKS 1, d = 15.6 kpc (Baumgardt & Vasiliev 2021), this translates to a γ-ray luminosity of
  erg s−1. We also examined the PLEC fit after excess subtraction. The model parameters remained largely unchanged compared to the pre-subtraction fit, except that the TS value further decreased to 18.3. The cutoff energy also remains unconstrained. In light of these results, we did not consider the PLEC model further in this work.
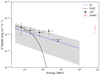 |
Fig. 2. Spectral energy distribution (SED) of the γ-ray emission originating from the direction of UKS 1, as observed by Fermi-LAT (black data points). The blue dashed-line is the best-fit PL model. The shaded region illustrates the uncertainty of this model. The PLEC fit is also plotted for comparison. Both models and LAT data in this plot are the results with the surrounding excess sources removed. The estimated energy flux derived from the differential flux given by the 3HWC data at 7 TeV is shown in red. |
2.2. Search for TeV feature in the direction fo GeV-detected GCs with 3HWC Survey data
To search for possible TeV features associated with GeV-detected GCs, we used data collected by HAWC during the survey with its complete instrumental configuration on the first 1523 days of operation2. This survey led to the compilation of the 3rd HAWC catalog of VHE γ-ray sources (3HWC; Albert et al. 2020). This reported 65 sources detected at a significance of ≥5σ, standing as the most sensitive TeV survey of the northern sky.
We started the search by cross-correlating the sources in the 3HWC catalog with the positions of GeV-detected GCs. The location of HAWC allows it to cover the sky within declinations from around −26° to 64°. Of the 45 GeV-detected GCs (44 in 4FGL-DR4, plus UKS 1), only 27 fall within the survey area. In an extended-source search assuming a disk-like morphology with a radius of 1° (Albert et al. 2020), the source 3HWC J1757-240 in the 3HWC catalog is located ∼38′ east from the center of UKS 1. The extension of this source overlaps with the complex W28 field that encompasses four known TeV sources: HESS J1801-233 and HESS J1800-240A/B/C (Aharonian et al. 2008).
While the interactions between the supernova remnant W28 and surrounding molecular clouds can produce γ-rays (e.g., Phan et al. 2020), we speculate that the low angular resolution of the extended-source search, as reported by Albert et al. (2020), might blend several sources into a single extended source. This will lead to a bias in identifying the nature of the source. To address this issue, we performed a search using the 3HWC significance map resulting from a point-source search, assuming a power-law energy spectrum with an index of 2.5. In the top panel of Fig. 3, we show a 6 ° ×6° 3HWC significance map centered on UKS 1. To better illustrate the significance variation, we have included the contours for significance levels of 3σ, 3.3σ, 4σ, and 4.3σ. The peak significance of the feature in proximity to UKS 1 is located at RA = 17h55m54.38s, Dec = −23 ° 57′30.96″ (J2000), with a significance of 4.4σ. With a trial factor of 27, this corresponds to a post-trial probability of 2.9 × 10⁻⁴ as fluctuation. It is displaced from the center of UKS 1 by ∼23′ in the direction of N60.7°E. Interestingly, we found the displacement almost traces the direction opposite to the proper motion of UKS 1 ((μα cos δ, μδ) = (−2.77, −2.43) mas yr−1; Fernández-Trincado et al. 2020), namely, toward S48.7°W. The direction of the GC’s proper motion is illustrated by the arrow in Fig. 3.
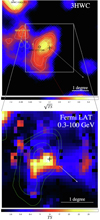 |
Fig. 3. Top panel: 6 ° ×6° 3HWC significance map around the center of UKS 1 from a point-source search with contours illustrating significance levels of 3σ, 3.3σ, 4σ, and 4.3σ. The location and extent of nearby TeV sources are indicated by yellow circles. The red-dashed lines shows the orientation of Galactic plane. Bottom panel: Close-up view within 3 ° ×3° of the Fermi-LAT TS map, with 3HWC contours overlaid. The black crosses and white arrows in both panels illustrate the center and the direction of the proper motion of UKS 1, respectively. Top is north and left is east. A scale bar of 1° is given in both panels. |
The location and extension of the nearby TeV sources found by Aharonian et al. (2008) are indicated by yellow circles in the top panel of Fig. 3. This shows that the feature associated with UKS 1 is well-resolved from nearby TeV sources. HESS J1801-233 is identified as a separate source in this significance map resulting from a point-source search and there is no evidence for any excess at the locations of HESS J1800-240A/B/C (the yellow circles in Fig. 3).
To compare the γ-ray excesses as observed by Fermi and HAWC, we show a close-up view of the 3 ° ×3° region centered on UKS 1 as observed by LAT with the 3HWC significance contours overlaid in the lower panel of Fig. 3. Both excesses are apparently extended in a similar orientation toward the Galactic plane (the red dashed line in the top panel of Fig. 3).
Based on 3HWC survey data, the differential flux at the peak position of the TeV feature is found to be  cm−2 s−1 TeV−1. Assuming the differential flux is at 7 TeV, we have also plotted the TeV flux together with the Fermi-LAT SED in Fig. 2 for comparison.
3. Summary and discussion
In this Letter, we report the detection of a GeV γ-ray feature at the location of the GC UKS 1, which may be associated with a TeV excess identified in the 3HWC survey data. While the TeV feature is well-resolved from other known VHE sources, it lies in a complex region of the γ-ray sky (H. E. S. S. Collaboration 2018), intersecting with the W28 supernova remnant field (Aharonian et al. 2008) and viewed through the Galactic bulge. As such, the possibility of source confusion or contamination cannot be firmly ruled out with current data. Thus, follow-up VHE γ-ray observations are needed to improve confidence in the association between the observed GeV and TeV features.
We estimated the full-band GeV γ-ray luminosity of UKS 1 to be  erg s−1, of which 20 percent is below 10 GeV and could be attributed to curvature radiation originating from its population of MSPs (e.g., Venter et al. 2009). Such a luminosity would imply the presence of a potentially large population of 119 ± 100 MSPs in UKS 1, if they have an average spin-down power of ⟨Ė⟩ ∼ 2 × 1034 erg s−1 and characteristic γ-ray conversion efficiency of ∼0.08 (Abdo et al. 2010). This population may operate as a powerful engine for the production of relativistic leptons and driving collective pulsar winds. However, the high velocity of UKS 1 through the Galactic disk (approximately ∼270 km s−1; see Fernández-Trincado et al. 2020; Baumgardt & Vasiliev 2021) would place the resulting bow shock at Rbs ≈ 0.6 pc under typical Galactic disk conditions (∼0.1 cm−3 for the warm ionized component of the interstellar medium) and assuming efficient mixing of pulsar and stellar winds, mass-loaded at a rate of ∼10−6 M⊙ yr−1 (Bednarek & Sobczak 2014). This distance is comparable to the core radius of UKS 1 (McCarver et al. 2024), suggesting that the GC wind would be confined by the bow shock, forming a trailing magnetotail. This configuration would result in a distorted, non-spherical VHE emission morphology.
Particles accelerated at this shock primarily cool via ICS in background interstellar and cosmological radiation and optical radiation fields from GC stars. Given the relatively low stellar luminosity of ∼4 × 10⁴ L⊙ for UKS 1 (Galactic GCs usually range from 105 − 106 L⊙; Hilker et al. 2020), the cooling length scale for particles at multi-TeV energies at the bow shock location is on the order of ∼100 pc (if adopting the relations in Bednarek & Sobczak 2014). This allows them to propagate deep into the GC’s magnetotail before losing significant energy, where the scattering in self-amplified magnetic turbulence isotropizes the particle pitch angle distribution. Thus, their displaced VHE ICS emission becomes observable (Krumholz et al. 2024).
This scenario is consistent with the observed 0.39° offset of the HAWC TeV emission peak, corresponding to a physical displacement of ∼100 pc, if the emission is driven primarily by particles of energies in the range of 1–10 TeV. It also accounts for the system’s relatively high TeV luminosity compared to the MSP spin-down power, as radiative ICS losses are not severe in the weak starlight of UKS 1. If the ≳10 GeV emission is dominated by ICS and the spectral shape resembles that of the VHE-confirmed Ter 5, we would estimate the full-band TeV ICS luminosity of UKS 1 may be as high as  erg s−1. For comparison, the starlight intensity in the direction of Ter 5 is much stronger, leading to more radiative cooling and a lower TeV-to-GeV flux ratio. As a result, the detected TeV-to-GeV flux ratio of UKS 1 is an order of magnitude higher than that of Ter 5 (see Kong et al. 2010; H. E. S. S. Collaboration 2011).
This interpretation sets UKS 1 apart from the typical GCs in our Galaxy. In particular, its expected large MSP population and relatively low stellar luminosity drives unusually bright GeV emission, substantial lepton injection, and, in particular, favorable conditions for extended, offset TeV emission. If follow-up observations confirm UKS 1 as the origin of the 3HWC γ-ray excess, it would not only firmly establish GCs as a distinct VHE source class, but also provide a natural laboratory to test cosmic ray transport theories given its particularly extended TeV emission.
Acknowledgments
C.Y.H. is supported by the research fund of Chungnam National University and by the National Research Foundation of Korea grant 2022R1F1A1073952. E.R.O. is supported by the RIKEN Special Postdoctoral Researcher Program for junior scientists, and also acknowledges support from the Japan Society for the Promotion of Science (JSPS) as a JSPS International Research Fellow while at Osaka University (grant number JP22F22327).
References
- Abdo, A. A., Ackermann, M., Ajello, M., et al. 2009a, Science, 325, 845 [NASA ADS] [CrossRef] [Google Scholar]
- Abdo, A. A., Ackermann, M., Ajello, M., et al. 2009b, ApJ, 703, 1249 [Google Scholar]
- Abdo, A. A., Ackermann, M., Ajello, M., et al. 2010, A&A, 524, A75 [NASA ADS] [CrossRef] [EDP Sciences] [Google Scholar]
- Aharonian, F., Akhperjanian, A. G., Bazer-Bachi, A. R., et al. 2008, A&A, 481, 401 [NASA ADS] [CrossRef] [EDP Sciences] [Google Scholar]
- Albert, A., Alfaro, R., Alvarez, C., et al. 2020, ApJ, 905, 76 [NASA ADS] [CrossRef] [Google Scholar]
- Ballet, J., Bruel, P., Burnett, T. H., Lott, B., & The Fermi-LAT collaboration 2023, arXiv e-prints [arXiv:2307.12546] [Google Scholar]
- Baumgardt, H., & Vasiliev, E. 2021, MNRAS, 505, 5957 [NASA ADS] [CrossRef] [Google Scholar]
- Bednarek, W., & Sobczak, T. 2014, MNRAS, 445, 2842 [CrossRef] [Google Scholar]
- Cheng, K. S., Chernyshov, D. O., Dogiel, V. A., Hui, C. Y., & Kong, A. K. H. 2010, ApJ, 723, 1219 [NASA ADS] [CrossRef] [Google Scholar]
- Fernández-Trincado, J. G., Minniti, D., Beers, T. C., et al. 2020, A&A, 643, A145 [Google Scholar]
- Freire, P. C. C., Abdo, A. A., Ajello, M., et al. 2011, Science, 334, 1107 [Google Scholar]
- Harris, W. E. 1996, AJ, 112, 1487 [Google Scholar]
- Henry, O. K., Paglione, T. A. D., Song, Y., et al. 2024, MNRAS, 535, 434 [NASA ADS] [CrossRef] [Google Scholar]
- H. E. S. S. Collaboration (Abramowski, A., et al.) 2011, A&A, 531, L18 [NASA ADS] [CrossRef] [EDP Sciences] [Google Scholar]
- H. E. S. S. Collaboration (Abdalla, H., et al.) 2018, A&A, 612, A1 [NASA ADS] [CrossRef] [EDP Sciences] [Google Scholar]
- Hilker, M., Baumgardt, H., Sollima, A., & Bellini, A. 2020, in Star Clusters: From the Milky Way to the Early Universe, eds. A. Bragaglia, M. Davies, A. Sills, & E. Vesperini, IAU Symposium, 351, 451 [NASA ADS] [Google Scholar]
- Hui, C. Y., Cheng, K. S., & Taam, R. E. 2010, ApJ, 714, 1149 [Google Scholar]
- Hui, C. Y., Cheng, K. S., Wang, Y., et al. 2011, ApJ, 726, 100 [NASA ADS] [CrossRef] [Google Scholar]
- Kong, A. K. H., Hui, C. Y., & Cheng, K. S. 2010, ApJ, 712, L36 [NASA ADS] [CrossRef] [Google Scholar]
- Krumholz, M., Crocker, R., Bahramian, A., & Bordas, P. 2024, Nat. Astron., 8, 1284 [Google Scholar]
- Mattox, J. R., Bertsch, D. L., Chiang, J., et al. 1996, ApJ, 461, 396 [Google Scholar]
- McCarver, A. V., Maccarone, T. J., Ransom, S. M., et al. 2024, ApJ, 969, 30 [NASA ADS] [Google Scholar]
- Phan, V. H. M., Gabici, S., Morlino, G., et al. 2020, A&A, 635, A40 [NASA ADS] [CrossRef] [EDP Sciences] [Google Scholar]
- Song, D., Macias, O., Horiuchi, S., Crocker, R. M., & Nataf, D. M. 2021, MNRAS, 507, 5161 [CrossRef] [Google Scholar]
- Tam, P. H. T., Kong, A. K. H., Hui, C. Y., et al. 2011, ApJ, 729, 90 [Google Scholar]
- Venter, C., De Jager, O. C., & Clapson, A. C. 2009, ApJ, 696, L52 [Google Scholar]
- Wu, J. H. K., Hui, C. Y., Wu, E. M. H., et al. 2013, ApJ, 765, L47 [Google Scholar]
- Yuan, M., Zheng, J., Zhang, P., & Zhang, L. 2022, Res. Astron. Astrophys., 22, 055019 [Google Scholar]
- Zhang, P., Xing, Y., & Wang, Z. 2022, ApJ, 935, L36 [Google Scholar]
- Zhang, P., Xing, Y., Wang, Z., Wu, W., & Chen, Z. 2023, ApJ, 945, 70 [Google Scholar]
Appendix A: Excesses around UKS 1 as observed by Fermi LAT
After subtracting contributions from the 4FGL sources, Galactic diffuse background and the extragalactic isotropic background, γ-ray excesses have been found in the field around UKS 1 (Fig. A.1). For better estimation of the detection significance and properties of UKS 1, these excesses have to be removed.
To account for their contribution, we first re-ran the likelihood analysis, adding point sources at locations A and B (see Fig. A.1) to the model, each modeled with a power-law spectrum. However, an excess remained at location C. To address this, we added an additional point source at location C and repeated the analysis. The results are summarized in tab:excess.
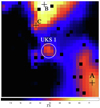 |
Fig. A.1. 3 ° ×3° Fermi-LAT TS map showing the γ-ray excess found around UKS 1. |
Locations and spectral parameters of additional point-source models used to account for and subtract the γ-ray excesses around UKS 1.
All Tables
Locations and spectral parameters of additional point-source models used to account for and subtract the γ-ray excesses around UKS 1.
All Figures
|
Fig. 1. Left panel: TS map of the 2 ° ×2° region centered on UKS 1 with the best-fit diffuse background and contributions from the 4FGL sources subtracted. The black circle represents the tidal radius (3.2′) of UKS 1 at a distance of 15.6 kpc (Fernández-Trincado et al. 2020). The colour scale shows the TS value of every bin of 0.1 ° ×0.1°. Right panel: Same as the left panel, but with three additional sources further subtracted (see Appendix A). |
| In the text | |
|
Fig. 2. Spectral energy distribution (SED) of the γ-ray emission originating from the direction of UKS 1, as observed by Fermi-LAT (black data points). The blue dashed-line is the best-fit PL model. The shaded region illustrates the uncertainty of this model. The PLEC fit is also plotted for comparison. Both models and LAT data in this plot are the results with the surrounding excess sources removed. The estimated energy flux derived from the differential flux given by the 3HWC data at 7 TeV is shown in red. |
| In the text | |
|
Fig. 3. Top panel: 6 ° ×6° 3HWC significance map around the center of UKS 1 from a point-source search with contours illustrating significance levels of 3σ, 3.3σ, 4σ, and 4.3σ. The location and extent of nearby TeV sources are indicated by yellow circles. The red-dashed lines shows the orientation of Galactic plane. Bottom panel: Close-up view within 3 ° ×3° of the Fermi-LAT TS map, with 3HWC contours overlaid. The black crosses and white arrows in both panels illustrate the center and the direction of the proper motion of UKS 1, respectively. Top is north and left is east. A scale bar of 1° is given in both panels. |
| In the text | |
|
Fig. A.1. 3 ° ×3° Fermi-LAT TS map showing the γ-ray excess found around UKS 1. |
| In the text | |
Current usage metrics show cumulative count of Article Views (full-text article views including HTML views, PDF and ePub downloads, according to the available data) and Abstracts Views on Vision4Press platform.
Data correspond to usage on the plateform after 2015. The current usage metrics is available 48-96 hours after online publication and is updated daily on week days.
Initial download of the metrics may take a while.