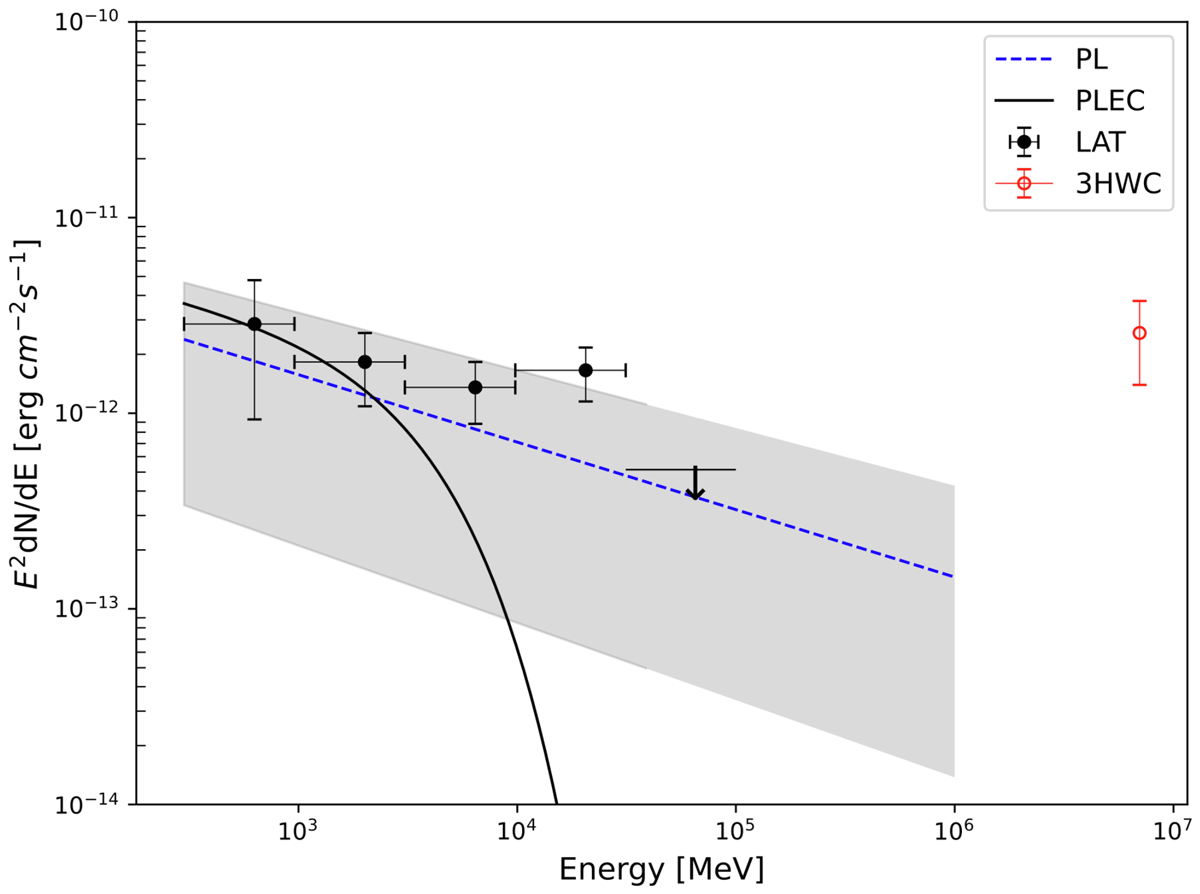
Fig. 2.
Download original image
Spectral energy distribution (SED) of the γ-ray emission originating from the direction of UKS 1, as observed by Fermi-LAT (black data points). The blue dashed-line is the best-fit PL model. The shaded region illustrates the uncertainty of this model. The PLEC fit is also plotted for comparison. Both models and LAT data in this plot are the results with the surrounding excess sources removed. The estimated energy flux derived from the differential flux given by the 3HWC data at 7 TeV is shown in red.
Current usage metrics show cumulative count of Article Views (full-text article views including HTML views, PDF and ePub downloads, according to the available data) and Abstracts Views on Vision4Press platform.
Data correspond to usage on the plateform after 2015. The current usage metrics is available 48-96 hours after online publication and is updated daily on week days.
Initial download of the metrics may take a while.