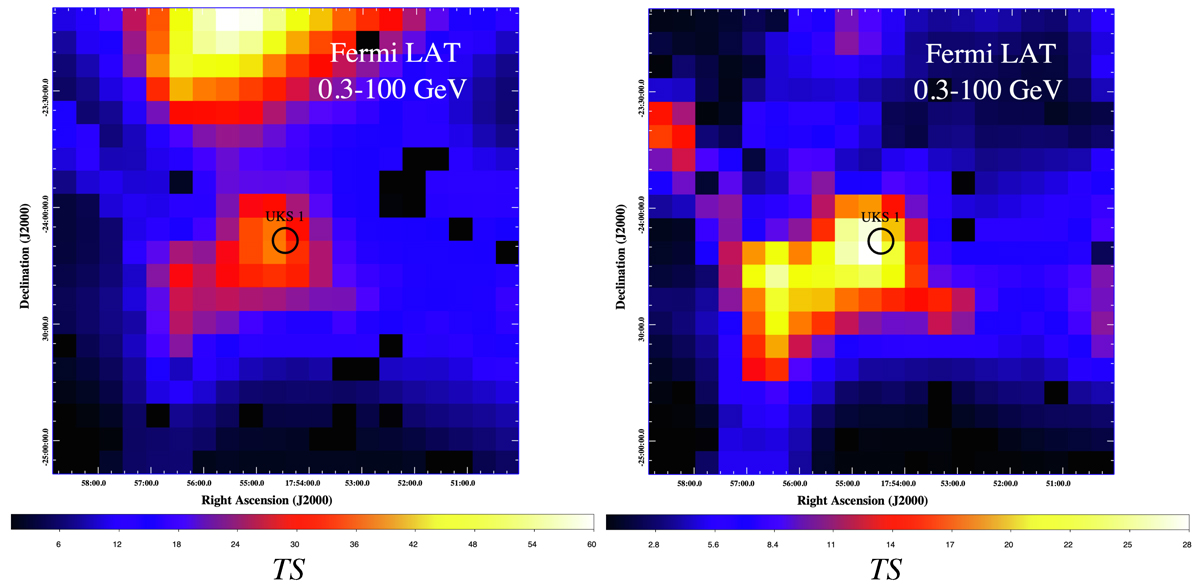
Fig. 1.
Download original image
Left panel: TS map of the 2 ° ×2° region centered on UKS 1 with the best-fit diffuse background and contributions from the 4FGL sources subtracted. The black circle represents the tidal radius (3.2′) of UKS 1 at a distance of 15.6 kpc (Fernández-Trincado et al. 2020). The colour scale shows the TS value of every bin of 0.1 ° ×0.1°. Right panel: Same as the left panel, but with three additional sources further subtracted (see Appendix A).
Current usage metrics show cumulative count of Article Views (full-text article views including HTML views, PDF and ePub downloads, according to the available data) and Abstracts Views on Vision4Press platform.
Data correspond to usage on the plateform after 2015. The current usage metrics is available 48-96 hours after online publication and is updated daily on week days.
Initial download of the metrics may take a while.