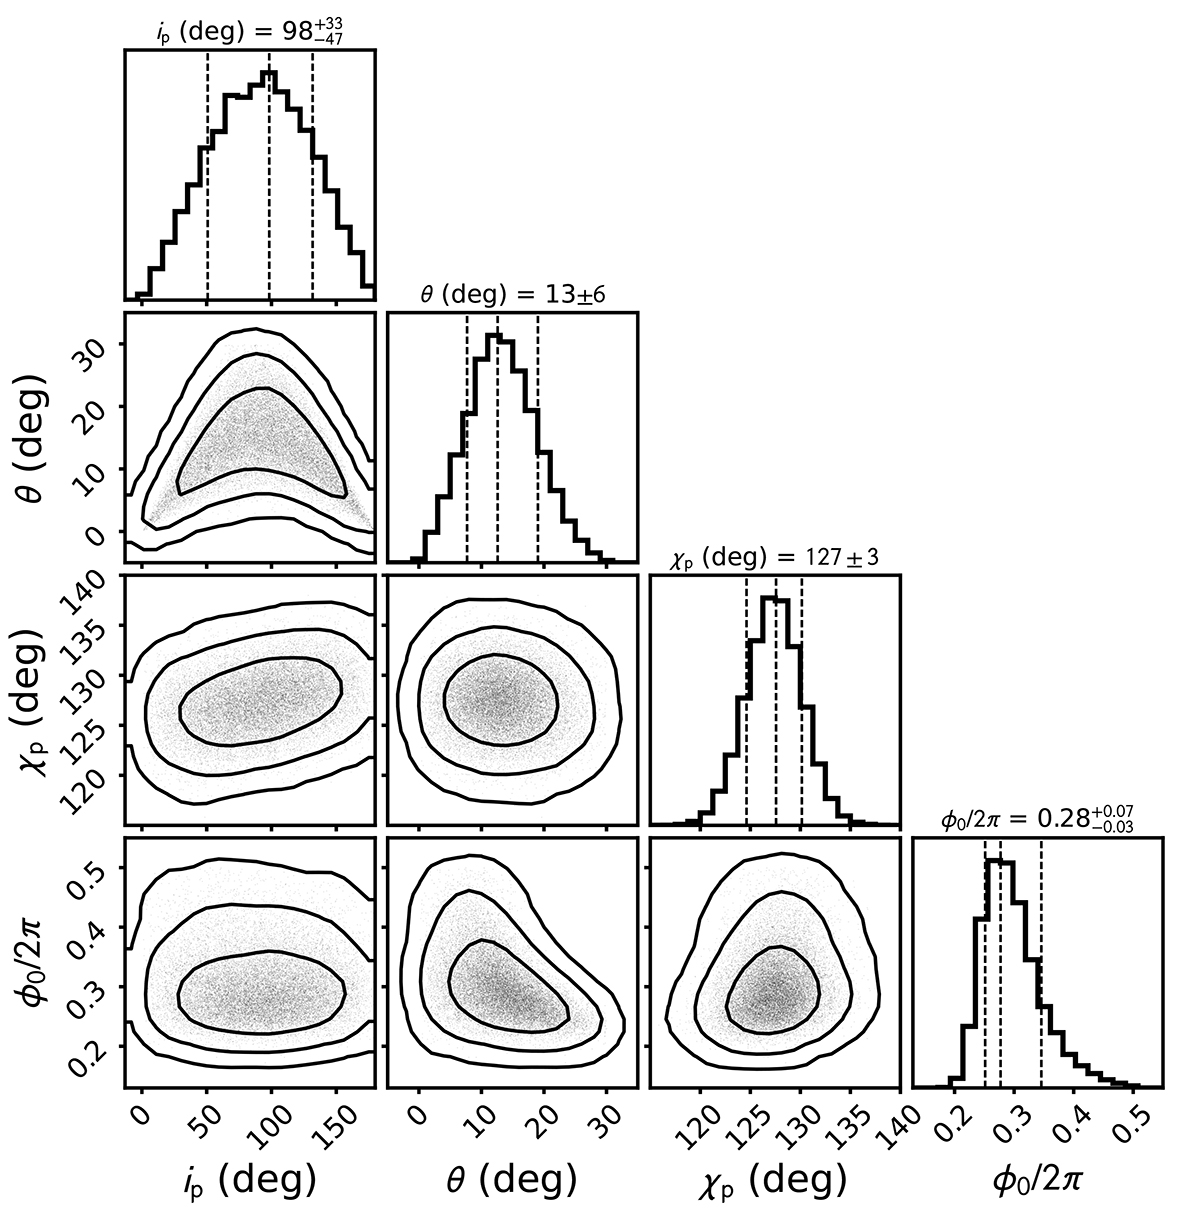
Fig. 8.
Download original image
Corner plot of the posterior distribution for the parameters of the RVM model fitted to the PA values obtained from the phase-resolved spectro-polarimetric analysis of the high-energy component. The two-dimensional contours correspond to 68.3, 95.45, and 99.73% confidence levels. The histograms show the normalized one-dimensional distributions for a given parameter derived from the posterior samples. The vertical dashed lines represent the mode of the distribution (central line) and the lower and upper quartiles (68% confidence interval). The mode is calculated using a Gaussian kernel density estimate with a bandwidth of 0.1.
Current usage metrics show cumulative count of Article Views (full-text article views including HTML views, PDF and ePub downloads, according to the available data) and Abstracts Views on Vision4Press platform.
Data correspond to usage on the plateform after 2015. The current usage metrics is available 48-96 hours after online publication and is updated daily on week days.
Initial download of the metrics may take a while.