| Issue |
A&A
Volume 696, April 2025
|
|
|---|---|---|
| Article Number | A120 | |
| Number of page(s) | 19 | |
| Section | Galactic structure, stellar clusters and populations | |
| DOI | https://doi.org/10.1051/0004-6361/202553755 | |
| Published online | 11 April 2025 | |
Inconsistent metallicity spreads in first-generation stars of globular clusters from high-resolution spectroscopy and HST photometry
INAF-Osservatorio di Astrofisica e Scienza dello Spazio di Bologna,
Via P. Gobetti 93/3,
40129
Bologna,
Italy
★ Corresponding author; This email address is being protected from spambots. You need JavaScript enabled to view it.
Received:
14
January
2025
Accepted:
17
February
2025
Abstract
An open issue about multiple stellar populations in globular clusters (GCs) is the possible existence of metallicity spreads in first-generation (FG) stars. Recent estimates based on the HST pseudo-colour map (PCM) derived unlikely large spreads in [Fe/H] from spreads in the colour col = mF275W − mF814W. The inferred metallicity spreads for many GCs are comparable to or even larger than the ones observed in dwarf galaxies. This result is clearly unexpected and at odds with the birth time of stars in dwarf galaxies, spanning several billion years, as opposed to the very short formation times of the stellar component in GCs (a few million years). The contradiction is corroborated by a comparison of the widths of red giant branches in both classes of objects. Moreover, the so-called spreads in FG stars estimated from the PCMs are always larger than the intrinsic metallicity spreads derived from spectroscopy. We used 30 pairs of FG stars with similar parameters in 12 GCs to highlight that a constant displacement in Δcol corresponds to variable differences in [Fe/H] up to 0.2 dex, depending on the GC. Providing for the first time quantitative measurements of the extension in Δcol of the sequences of FG and SG stars, we find no relation between the metallicity spreads previously derived and extension of FG stars. We find that the length of the FG region correlates with the average global metallicity of GCs, and not with the observed metallicity spreads. The extension of FG stars also correlates with the extension of SG stars, and the global mass of the GCs. Our findings seriously challenge the scenario claiming more inhomogeneous mixing among FG stars, invalidating previous speculations in the literature.
Key words: stars: abundances / stars: atmospheres / stars: Population II / globular clusters: general
© The Authors 2025
 Open Access article, published by EDP Sciences, under the terms of the Creative Commons Attribution License (https://creativecommons.org/licenses/by/4.0), which permits unrestricted use, distribution, and reproduction in any medium, provided the original work is properly cited.
This article is published in open access under the Subscribe to Open model. This email address is being protected from spambots. You need JavaScript enabled to view it. to support open access publication.
1 Introduction
A still-unsolved issue with multiple populations (MPs) in globular clusters (GCs) concerns the possible existence of metallicity spreads among first-generation (FG) stars. These stars formed in the primary star formation phase at the very beginning of the lifetime of these old stellar systems, shortly after the Big Bang (e.g. Carretta et al. 2000; VandenBerg et al. 2013). As is hinted at by their narrow photometric sequences in the colour-magnitude diagrams (CMDs), GCs do not have an extended star formation. In particular, FG stars have an abundance pattern analogous to field halo stars of similar metallicity, bearing traces only of supernova (SN) nucleosynthesis; that is, enhanced levels of α–elements typical of contributions from massive stars exploding as corecollapse SNe. Type Ia SNe, with their longer evolving times, do not make a noticeable contribution to the chemistry of most GCs, as is proven by the homogeneity of Fe-peak species in the majority of GCs (better than 12% or less than 0.05 dex, Carretta et al. 2009a; see also, e.g. Bailin & von Klar 2022; Willman & Strader 2012). The most massive objects among FG stars provide the nuclearly processed matter, enriched in proton-capture elements from H-burning at high temperature, which together with varying amounts of pristine gas produces the chemical composition typical of second-generation (SG) stars (e.g. Langer et al. 2003, Gratton et al. 2001), although the exact nature of the polluters is still debated (e.g. the reviews by Gratton et al. 2004, 2012, 2019, and Bastian & Lardo 2018).
First-generation stars can be easily separated from SG stars directly, deriving their abundances with spectroscopy. The chief disadvantage is the time-consuming nature of the observations, although this is mitigated by the use of efficient spectrographs with a high multiplexing gain at large telescopes. The tagging of MPs can also be indirectly performed by photometric means, by exploiting the effect of different abundances involved in the H-burning on filters at the bandpasses appropriate to sample spectral regions where main molecular bands associated with CNO products are located. Photometric methods have the benefit of sampling many more stars in a short time; their main handicap is that they primarily follow the N abundance, obtained using filters encompassing the ultraviolet or blue regions where NH or CN features are located (e.g. Calamida et al. 2007; Sbordone et al. 2011; Carretta et al. 2011a; Lardo et al. 2011; Lee et al. 2009; Milone et al. 2017; Johnson et al. 2023). Hence, the photometric approach essentially measures the N content in different populations and is prone to some ambiguity, since N can be generated by the conversion of C for temperatures above 10 MK, but also from O when the ON branch of the CNO cycle is activated at higher temperatures.
Discrepancies between the spectroscopic and the photometric approaches in tagging MPs were examined in Carretta & Bragaglia (2024; hereinafter CB24), using pseudo-colour maps (PCMs) and high-resolution spectroscopy for 22 GCs. We showed that PCMs are able to provide a coarse division of MPs, with FG and SG stars usually separated into two groups, with an efficient trade-off between the limited observing time and number of surveyed stars. However, we found that photometric methods tend to overestimate the fraction of FG stars, with the number of mismatches depending on the GC mass (CB24). This happens both with ground-based and space-based photometry.
Notation adopted in the present paper.
The results by CB24 suggest that the photometric approach is sound, in broad terms, but may still not be completely understood. Many of the conclusions based on PCMs seem to still be based on empirical evidence and some inferences may be misleading.
In the present paper, we use the sample of PCMs in CB24, the only one published so far, to explore in detail claims about the possible existence of a metallicity spread among FG stars. Our purposes are to ascertain whether a spread in [Fe/H] is truly connected to the extension of the region of FG stars in the PCM, whether the spread in the region of SG stars also indicates a metallicity dispersion in this population, and finally to disclose potential inconsistencies between spectroscopy and HST photometry in this issue regarding MPs.
For clarity, in Table 1, adapted from CB24, we reproduce the simplified notation to describe the PCMs, a detailed description of which can be found in Milone et al. (2017: M17). Here, we added the definition of RG1 as the region in the PCM populated by FG stars, and analogously of RG2 as the locus in the PCM with a preponderant presence of SG stars.
The problem of possible metallicity spreads among GC stars seems to be primarily based on indirect inferences. None of the candidate polluters proposed as sources of matter enriched in proton-capture elements also produces variations in metallicity, so the [Fe/H] content of MPs is expected to be very homogeneous, as is supported by the cosmic scatter of iron in GCs (e.g. Carretta et al. 2009a). However, from the still-unpublished PCMs of 55 GCs, M17 state that the extension of the RG1 (see Table 1) is too large if compared to the photometric errors obtained by bootstrap technique. Milone et al. (2017) claim that this comparison implies that FG stars may have a dishomogeneous composition. Since the x coordinate (Δcol) in the PCMs is mainly sensitive to variations in the effective temperature of stars (through the differential use of a long baseline colour), changes in He content or in metallicity were proposed as being responsible for the observed spread. Since FG stars should not have an enhanced He level due to H-burning in massive polluters, Milone et al. argue that the extension of RG1 along Δcol is entirely due to metallicity variations.
Legnardi et al. (2022: L22) extend the work of M17, who only considered red giant branch (RGB) stars, to the main sequence (MS) of two GCs (NGC 6362 and NGC 6838) that were also observed with HST in the same filters. They find essentially the same results for RGB and MS stars; that is, a separation between RG1 and RG2 (although clearer on the RGB due to the much smaller photometric errors) and an elongation of the RG1 distribution in Δcol that is larger than that of RG2 and of the estimated errors. They further check the possibility that such a spread could be due to the presence of binaries or a spread in helium. As for M17, the latter occurrence is difficult to reconcile with the fact that these stars represent the primordial population of the GC, without any chemical variations due to polluters. Based on simulations, they discard the two explanations and attribute the spread in Δcol solely to a spread in metallicity. They then proceed to translate the width of FG stars on the RGB measured by M17 – that is,  – to a spread in metallicity, using the colour-metallicity relations of Dotter et al. (2008). This procedure results in spreads from about 0.05 to 0.3 dex (their Table 3).
In the present paper, we first highlight the inconsistency of metallicity spreads in FG stars as derived in L22 from the PCMs with the dispersions observed in [Fe/H] with high-resolution spectroscopy (Section 2). We then use a large set of stars identified with spectroscopic criteria as FG stars in 20 GCs (CB24) to analyse the discrepancies between spectroscopy and HST photometry and to investigate the dependence of the coordinate Δcol on [Fe/H], providing empirical constraints to the true rate of changes in both metallicity and Δcol (Section 3). In Section 4, we quantify for the first time the real extension of the sequence of FG stars in the PCM. These precise measurements are compared with global parameters of GCs to study dependences and possible correlations. Section 5 is devoted to scrutinising the existence of possibly neglected metallicity spreads among SG stars. Finally, in Section 6 we present our conclusions and further implications of our findings.
2 Metallicity spreads of GC FG stars in context
From the extension in Δcol of the RG1 in the unpublished PCMs of GCs, L22 advocate that metallicity spreads must be present among the stars born in the primary star formation within GCs. The magnitude of the spread derived for many GCs is significantly overestimated using their approach. The values of the metallicity spread attributed by L22 to FG stars are generally too large for stellar systems long known to be homogeneous in heavy elements, as is supported by their narrow photometric sequences in the CMDs.
To better visualise this inconsistency, in Fig. 1 we compare the estimates of L22, δ[Fe/H](FG), to the intrinsic metallicity dispersions obtained by Bailin & von Klar (2022). They update the estimates of Bailin (2019) of the internal dispersion, σ0, from high-resolution spectroscopy of RGB stars, taking into account both random and systematic errors associated with the abundance analysis. The values by Bailin and von Klar are referred to the total internal spread in iron abundance, without any distinction between FG and SG stars.
With the notable exception of ω Cen, the intrinsic iron spreads in GCs are usually small, mostly below 0.1 dex. In contrast, FG spreads derived in L22 show a long tail extending to dispersions in [Fe/H] as large as 0.2−0.3 dex, the record being NGC 5024, with a spread of 0.307 dex.
The studies of L22 and Bailin & von Klar (2022) only have 33 GCs are in common. Furthermore, for some GCs the number of stars for which an abundance analysis has been undertaken from high-resolution spectroscopy is limited. A more complete and instructive view of the soundness of the estimates by L22 is provided in Fig. 2, in which the [Fe/H] spreads of FG stars in all 55 GCs analysed in L22 (open black squares) are plotted as a function of the total absolute magnitude of the GCs, a proxy for the present-day total stellar mass, from Harris (2010). In the same figure, a variety of other stellar systems from the compilation by Willman & Strader (2012) are also reported. To explore a meaningful definition of “galaxy”, they used a Bayesian Markov chain Monte Carlo technique to derive consistent intrinsic metallicity spreads for 24 GCs and 16 dwarf galaxies and satellites of the Milky Way. The GCs considered are mostly from our homogeneous FLAMES survey of a large sample of stars in GCs (Carretta et al. 2009b), plus other literature data for M 22 and ω Cen. Complete references for the sample of dwarfs can be found in Willman & Strader (2012).
From Fig. 2, several conclusions can be drawn. First, in this figure the vast majority of [Fe/H] spreads advocated for a limited fraction of stars (the FG stars) in each GC are much larger than the estimates obtained from spectroscopic observations of the GCs as whole systems. Second, it is not clear whether a trend as a function of mass is present for the values of L22, whereas an increase in the global spread for GCs of an increasingly large mass is rather evident. Third, and most astonishingly, a few estimates of L22 are comparable to or even exceed the metallicity dispersion observed in much more massive dwarf galaxies.
In particular, this is true for the values derived by L22 for NGC 5024 (M 53) and NGC 5272 (M 3), with δ[Fe/H](FG) = 0.307 and 0.252 dex, respectively. These are exceptionally large amounts, since both M 53 (Boberg et al. 2016) and M 3 (Cohen & Melendez 2005; Sneden et al. 2004) are GCs that are known to be extremely homogeneous in terms of the abundance of heavy elements. According to L22, NGC 5024 would host among its FG stars a larger metallicity spread that the one detected in ω Cen1. In addition, several GCs in Fig. 2, including M 53 and M 3, have an iron spread in FG that is larger than the metallicity dispersion in M 54 (NGC 6715), the massive GC in the core of the tidally disrupting dwarf spheroidal galaxy Sagittarius, in which M 54 probably represents the nuclear star cluster (Siegel et al. 2007; Carretta et al. 2010a).
At a given absolute luminosity, the colour of the RGB has a negligible dependence on the stellar mass, and hence on the age of the stellar population, at least for ages of more than a few gigayears (e.g. Salaris, Cassisi, Weiss 2002). On the other hand, the position of a star across the RGB is strongly affected by the value of the metallicity. By comparing the colour spreads of the RGBs of the old stellar populations in the systems discussed above, one can get an immediate quantitative idea of the soundness and ranking of the different estimates. This comparison is done in Fig. 3, using, for simplicity, the Gaia bandpasses to overcome problems related to the variety of photometric systems used for GCs and dwarfs. Metal-rich stars would be located on the red side of the RGB, whereas metal-poor stars would populate the bluer region, regardless of the selected bandpass.
To obtain the best sample of stars in NGC 5024, we considered the photometric constraints described in Leitinger et al. (2023). They used the UBVRI photometry by Stetson et al. (2019) and then cross-matched the resulting sample of stars with the database of H. Baumgardt2 of member stars in GCs. Red points in Fig. 3 are stars in NGC 5024 with a membership probability of ≥0.9. Arbitrary shifts in colour, GBP −GRP, and in Gmag were applied to make the RGB tip approximately coincide for all the systems compared, as we were simply interested in comparing the size of the spread in colour as a proxy of the metallicity spread.
We took the metallicity information for the dwarf spheroidals (dSph) Leo I and Fornax from Kirby et al. (2010), who used Keck/DEIMOS medium-resolution spectroscopy combined with spectral synthesis to derive them. That catalogue was crossmatched with Gaia data release 3 (GDR3, Gaia Collaboration 2023) to obtain the magnitudes in the Gaia bandpasses for a direct comparison with the GC CMDs. The sample of GC stars in ω Cen (NGC 5139) and NGC 6715 (M 54) are from Stetson et al. (2019) and have also been cross-matched with GDR3.
The [Fe/H] spread in FG stars for NGC 5024 from L22 (0.307 dex) is slightly larger than the value reported by Willman & Strader (2012) for Fornax. The latter, unlike GCs, is known to have experienced extended star formation lasting several gigayears, as is demonstrated by the width of the metallicity distributions and the age spreads deduced from its broadband colours (combined with spectroscopic metal abundances, e.g. Battaglia et al. 2006).
In the CMD of NGC 5024, stars on the asymptotic giant branch are easily recognisable, and the stars unambigously on the RGB form a very narrow sequence, as is expected for a stellar population with the same age and composition. Old populations on the RGB of dSphs, on the other hand, show a much larger spread in colour that is more consistent with measured spectroscopic spreads of [Fe/H] of about 0.3 dex (Kirby et al. 2010, Willman & Strader 2012). The luminosity-Z spread relation observed in dSphs (e.g. Kirby et al. 2011) showed that dSphs were able to sustain a star formation of long duration thanks to their ability to retain the gas, which is more effectively done by the more luminous galaxies. Conversely, the formation of GCs was an extremely fast event: none of the proposed scenarios (e.g. Bastian & Lardo 2018; Gratton et al. 2019) involves star formation histories that last more than a few tens of millions of years, after which only passive evolution takes place. This time limit was established by relying on the evolving times of various plausible candidates proposed for the enrichment in light, proton-capture elements characterising the MPs in GCs and the simultaneous lack of variations in heavier elements in most GCs.
Also instructive is the comparison shown in the lower two panels of Fig. 3, in which NGC 5024 is plotted against the RGB colour distribution of the two most massive GCs in the Galaxy: ω Cen and M 54. Both GCs have an intrinsic [Fe/H] spread that is well documented from spectroscopic or photometric measurements, and both are considered to be former nuclear star clusters of dwarf galaxies (e.g. Bekki & Freeman et al. 2003; Carretta et al. 2010a, see also the review by Gratton et al. 2004). Again, the spread in NGC 5024 estimated for FG stars by L22 seems to be completely at odds with the large values measured in the two massive GCs, as the comparison of the CMDs unambigously shows (see also Fig. 1).
Typical uncertainties in magnitudes and colours are indicated by the error bars in Fig. 3, estimated from Table 3 of Gaia Collaboration (2018a) and figure A.7 of Gaia Collaboration (2018b). While the faint end of RGB in the more distant dwarf galaxies is close to the limits of precise Gaia photometry, the comparison at the bright regime does not support a correspondence between colour spreads and metallicity dispersions derived by L22. This is even more evident when the comparison involves NGC 5024 and other GCs like ω Cen and M 543.
Beside this direct comparison of observables in the RGB, there is also theoretical support that the metallicity spreads given in L22 were probably overestimated and are unrealistic. The proto-GC clouds out of which ω Cen and M 54 formed were massive enough to satisfy the theoretical prerequisites for showing clear evidence of self-enrichment. These requirements are well illustrated by Dopita & Smith (1986) and include primary star formation with SN explosions and a potential well that is deep enough to trap the ejecta, which must be able to cool enough to be used later in the following phase of secondary star formation.
For star formation to occur in gas enriched by SNe that exploded in the primary star formation, the ejecta must cool and remain trapped in a layer of gas that is both gravitationally bound to the cloud and able to become self-gravitationally unstable. These constraints imply that there is a mass limit for the progenitor of GCs to sustain some self-enrichment. Dopita & Smith (1986) calculated that energetic SN ejecta can only be slowed below the escape velocity of the cloud, by explosions close to the mass center, in clouds that are more massive than ∼3 × 10⁶ M⊙. Explosions near the tidal radius would result in gas- and metal-enriched ejecta being unavoidably lost to the intergalactic medium. At the low extreme, clouds would be completely disrupted by SN explosions if less massive than ∼105 M⊙. The bottom line is that only the most massive clouds are destined to form the final, self-enriched GCs.
A quantitative idea of the fraction of Galactic GCs potentially capable of satisfying these criteria is given in Fig. 4. The initial mass estimates for the population of GCs in the Milky Way (Baumgardt et al. 2019) are plotted as a function of the present-day masses (represented by the total absolute magnitude). The solid line shows the lower mass limit for a proto-cluster cloud to efficiently retain SN ejecta according to the calculations by Dopita & Smith (1986). Only three GCs (namely ω Cen, M 54, and Liller 1) are expected to be above this threshold. NGC 5024 (filled red circle) lies well below the required value, even at the estimated beginning of its evolution, before its mass is next reduced by dynamical evolutionary effects (both internal and external).
We know, of course, that actually a number of GCs present traces of pollution by SNe, in various amounts. These are the GCs named iron complex clusters by Johnson et al. (2015): M 2, NGC 1851, M 54, ω Cen, NGC 5286, NGC 5824, NGC 6273, Terzan 5, and M 22. A recent addition to this group is Liller 1 (Fanelli et al. 2024). The iron complex GCs are indicated in Fig. 4 as filled blue points and the dashed line (at about 9 × 10⁵ M⊙) defines the lower envelope for initial masses of these massive GCs. NGC 5024 lies just below the group of iron complex GCs, but allowing for uncertainties in the estimates of the initial masses of objects that are just slightly younger than the Universe, it could even match this less stringent constraint. However, the striking difference in the [Fe/H] spread between NGC 5024 and GCs with a spectroscopic spread of 0.3 dex still lingers. Boberg et al. (2016) find a dispersion of only 0.07 dex associated with the mean metallicity of NGC 5024 from a large sample of stars. This value is more similar to the one detected for NGC 1851 (Carretta et al. 2011b), a member of the iron complex GCs with a minimal inhomogeneity in [Fe/H].
The conclusion of the present section is that the metallicity spread for FG in NGC 5024 (as well as for NGC 5272) computed by L22 from the PCM seems to be largely overestimated. Neither simple observations based on the comparison of the RGB colour spreads nor theoretical model constraints seem to support the notion of an iron spread as large as the one advocated by L22 for these two GCs. Since the method used for NGC 5024 and NGC 5272 is not different from the one applied to the other GCs, a logical inference is that the estimates of the [Fe/H] spread in FG stars of all GCs are probably overestimates. These greatly overstated values derived from the PCMs could probably explain the discrepancies between high-resolution spectroscopy and HST photometry that are probed in the next Section.
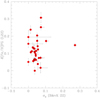 |
Fig. 1 Metallicity spreads for FG stars derived from PCMs by L22 as a function of the intrinsic dispersion in [Fe/H] calculated in Bailin & von Klar (2022) for 33 GCs that the two studies have in common. |
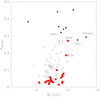 |
Fig. 2 Spread in [Fe/H] for FG stars in 55 GCs (open black squares) as a function of the GC present-day mass expressed by the total absolute magnitude, MV (Harris 2010). Metallicity spreads were derived from PCMs by L22. Filled red circles and black triangles are spectroscopic [Fe/H] spreads σ[Fe/H] of GCs and dwarf galaxies, respectively, from Willman & Strader (2012). A few interesting objects are labelled in the figure. |
 |
Fig. 3 Comparison of the RGBs in the CMDs of GCs and dwarf galaxies. Upper panels: NGC 5024 (M 53, filled red points) is compared to the dwarf galaxies Fornax and Leo I (empty circles). Lower panels: Comparison of NGC 5024 with two massive GCs, ω Cen and M 54 (left and right panel, respectively). The inset in each panel shows the metallicity distribution of the compared samples. Typical error bars in the Gaia photometric system are indicated. |
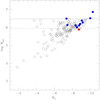 |
Fig. 4 Initial masses of GCs from Baumgardt et al. (2019) for the population of GCs in the Milky Way plotted as a function of the present-day total absolute luminosity. Solid and dashed lines indicate values of ∼3 × 10⁶ M⊙ and 9 × 10⁵ M⊙. The filled red circle represents NGC 5024 and blue circles indicate GCs presently known to have, to some extent, a metallicity dispersion. |
3 Discrepancies between spectroscopy and HST photometry
The approach used by L 22 to derive a putative metallicity spread among FG stars is to link the extension of RG1 to the width W1g of FG stars on the RGB in the CMD mF814W versus col taken from M17. The underlying principle is that stars of different metallicities occupy different sides of the RGB.
From Section 2, what does not add up is the sheer (and unbelievably large) size of the spreads attributed to FG stars, derived by L22 by translating W1g into metallicity. This was done using a generic “colour-metallicity relation” from Dotter et al. (2008). If the method used by L22 is the equivalent of interpolating mean ridge lines of GCs at different metallicities, but instead simply employing theoretical isochrones, it is susceptible to even larger errors. Salaris et al. (2002) stated that at fixed magnitude on the RGB, a colour difference in V − I of about 0.05 or 0.10 mag translates into uncertainties as large as ∼0.3−0.5 dex when [Fe/H] is determined from the comparison of observed and theoretical RGBs.
For the first time, it is possible to test this scenario and obtain a more sound estimate of the variation in [Fe/H] among FG stars thanks to the large (and so far unique) published database of stars used for the chemical tagging of the PCMs in CB24. From the few hundred stars for which there is both HST photometry and high-resolution spectroscopy, identified in 22 GCs, we considered 159 FG stars. These stars lie on the RG1 and are classified as FG with spectroscopy, according to their Na abundance, since we showed that a number of stars tagged using photometric criteria are actually mismatches; that is, FG stars misclassified as SG stars and vice versa (CB24). We prefer to rely on the criterion based on Na, since the abundance from spectroscopy is the direct discriminant for MPs in GCs (see Carretta et al. 2009b).
A popular technique to investigate possible metallicity spreads among FG stars is the so-called differential abundance analysis of stars with nearly identical atmospheric parameters, since it permits there to be very small uncertainties associated with the derived abundances (see e.g. Lardo et al. 2023). The precise abundances can then be related to the position of stars along RG1.
To get a better insight into the true link between the extension of RG1 and iron spread, we applied a similar method, starting with the large above sample of 159 FG stars. We further culled the sample by rejecting the stars found to be misclassified as FG by photometry (CB24). Additionally, we excluded four other stars classified as SG from their Na abundances and not recognized in CB24. Eight stars were also conservatively rejected due to their uncertain position between RG1 and RG2. In each GC, we then searched and paired stars with similar atmospheric parameters. Finally, we ended up with 46 genuine FG stars in 12 GCs. We combined these stars in 30 pairs with a maximum effective temperature difference of 32 K (on average the difference in Teff is −4.6 K, rms = 16 K). The pairs are listed in Table A.1 of Appendix A. For each pair of stars, we report the identification of the pair, the position in the RG1 of the PCM, the values of [Fe/H] and [Na/Fe], the star ID from Nardiello et al. (2018), where the stellar coordinates can be found, the name of the GC with its average metallicity, and the atmospheric parameters, effective temperature, surface gravity, model abundance [A/H], and microturbulent velocity. References for the abundance analysis are given in the last column. Most of the analysis is from our homogeneous FLAMES survey (see Carretta et al. 2006), except for NGC 6121, for which we used an independent source (Marino et al. 2008) as a safety check.
The similarity of atmospheric parameters means that by comparing the stars in each couple we are doing an extensive differential analysis. If there is any metallicity spread in any given GC, the assembled dataset of stars with nearly identical parameters should reveal a correlation between [Fe/H] and position along the Δcol in RG1.
The results of this exercise are plotted in Figs. A.1 and A.2. At the top of each panel, we report the GC name, the absolute value of the metallicity difference of the two stars (the order of the stars in each pair is not relevant), and their absolute difference along the Δcol coordinate in RG1 of the PCM (we are interested only in mapping the distance between the stars). Moreover, the metallicities of the stars are labelled at the bottom of each panel. We always put the [Fe/H] value of the star with the bluer Δcol value on the left and the value of the redder Δcol star on the right. Stars with very similar parameters can be used to form more than a single pair.
The first clear evidence from these figures is that the star at bluer Δcol is not always the most metal-poor one (pairs 2, 5, 7, 11, 13, 14, 19, 21, 23, 24, 25, and 29). In these cases, the bluer position is occupied by the more metal-rich star in the couple, albeit sometime by tiny amounts in [Fe/H].
Second, stars at the same position (or a very similar one) in RG1 have noticeably distinct [Fe/H] values (pairs 1, 7, 9, 11, 15, 19, 20, 21, 22, and 25). Vice versa, in some other cases small amounts of difference in [Fe/H] (from 0.01 to less than 0.05 dex) correspond to a large distance in Δcol (pairs 2, 3, 4, 5, 12, 13, 17, 27, and 30).
The relation between the displacement in [Fe/H] and in Δcol is summarised in Fig. 5. As could be inferred from the above discussion, there is no correlation or proportionality between these quantities. For 30 pairs of stars, the mean value of the shift in Δcol is 0.090 mag (rms = 0.114 mag). This nearly constant shift corresponds to a large range of metallicities, up to 0.2 dex, between stars in pairs, although the average difference in [Fe/H] is not significant (0.049 dex, rms = 0.045 dex).
Only in NGC 3201 do large differences in [Fe/H] seem to be matched by large differences in the length of the RG1. Even in this GC, however, the apparent correlation is not statistically significant (two-tails probability of p = 0.32, four data points).
On the other hand, from Figs. A.1 and A.2 it is clear that most of the extended RG1 sequence in NGC 2808 is explained by a couple of stars with differences in [Fe/H] of 0.04, 0.01, and 0.05 dex only (pairs 2, 3, and 4, at odds with the results by Lardo et al. 2023), whereas L22 claim an unrealistically large iron spread of 0.110 dex to explain the length of RG1 in this GC. The conclusion from this extensive differential analysis is that there seems to be no simple or direct correspondence between metallicity spread and extension of the RG1 region in the PCMs.
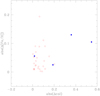 |
Fig. 5 Summary of the variations in [Fe/H] as a function of the Δcol variation along the RG1 region on the PCM from 30 pairs of FG stars with similar atmospheric parameters. The plotted values are the absolute differences in [Fe/H] and Δcol between the two stars in each pair. Pairs formed with stars in NGC 3201 are plotted as filled blue circles. |
4 Quantifying the extension of the RG1 sequences in the PCM
Despite the results from the previous section, a different location of stars in Δcol on the RG1 in the PCMs according to the metallicity of the star should be expected. The colour col = mF275W −mF814W (and, differentially, the pseudo-colour, Δcol), with its long baseline, is sensitive mostly to the effective temperature of stars (see e.g. CB24). Hence, the spread in Δcol suggests the inference made by M17 and L22 of a metallicity spread, since the He content of a FG star is the one established by the Big Bang nucleosynthesis, by definition.
For a given age, metal-poor stars are located on the blue side of the RGB in the CMD, while metal-rich stars lie on the red side. In the same way, when building a PCM, stars with lower metallicity are expected at bluer (more negative) Δcol values, whereas metal-rich stars can be expected to be at redder (less negative) values of Δcol along RG1. However, neither L22 nor M17 provide a precise quantity to express what they mean by the statement that the extension of RG1 is too large with respect to the errors. No precise measurements of this extent are given or published.
We have fixed this shortcoming by providing for the first time the extension of RG1 in the PCMs of the GCs published in CB24. To quantify the sequence, RG1, we used three kinds of indicators (see the sketch in Fig. 6): (1) the interquartile range iqrFG in Δcol of the FG stars, to minimize the uncertainties introduced by outliers; (2) the rms relative to the mean Δcol value of the FG stars, rmsFG; and (3) the major axis of the ellipse that best encloses the RG1 sequence, lenRG1.
In more detail, first we isolated FG and SG stars for each GC on the corresponding PCM. Conservatively, we dropped from the CB24 sample NGC 6388 and NGC 6715, whose uncertainties due to the high reddening and to field contamination could somehow hamper the results. The measurements for all the other 20 GCs are listed in Table 2.
Extensions and spreads in Δcol for RG1 and RG2.
The selection of stars to be assigned to RG1 and RG2 is made interactively using TOPCAT (Taylor 2005); in most cases, the selection, which is simply done visually, is straightforward, while in other cases there is some ambiguity. This is true also for the PCMs computed by M17, as is clearly shown in their plots. We verified that these groups are properly located in the mF814W − col and mF814W − col3 CMD in the position where FG and SG stars lie. Our selection is shown for all GCs in the figures in Appendix A, in which FG and SG stars are plotted in red and blue, respectively, whereas stars with an uncertain attribution are in grey. Stars in this latter group are always a minority. In the worst case (NGC 2808), they are less than 15% and they do not alter our results as they are clearly located slightly outside the tight sequences of the RGB.
Once we had the samples of FG stars, we did a linear interpolation so that we could measure the inclination of the FG distribution in the PCM. This is also the inclination of the ellipse that best encloses the FG stars, apart from a few slight adjustments made by eye. The values of the position angles are measured clockwise starting from the x-axis of the PCM and listed in Table 2.
The orientation of the RG1 region is similar, but not equal among GCs (see Fig. 7). This is in contrast with the procedure by M17, who adopted a line with a fixed inclination (an angle of 18 degrees with respect to the x axis in the PCM) to separate FG and SG stars. Although the average inclination in our sample of GCs (24.75 degrees, with an rms = 10.11) does not seem to be very different from the value used by M17, the individual RG1 s span a range, from 7 degrees in NGC 6121 up to the steep 50 degrees of the FG stars in NGC 288.
All the derived indicators, iqrFG, rmsFG, and lenRG1, are tightly correlated with each other, as is shown in the upper part of Table 3 (correlations 1, 2, and 3). They measure essentially the same quantity and are equivalent as true estimates of the extension of RG1 in the PCMs. In this table, we list for each correlation the involved parameters, the Pearson’s correlation coefficient for the linear regression, and the two-tails probability testing the null hypothesis that the observed values come from a population in which the true correlation is zero. We also measured the extension in Δcol of the RG2 sequence, again taking into consideration the interquartile range iqrSG and the rmsSG values. Due to the shape of the RG2 regions, it was not possible to use simple geometric forms such as the ellipse to measure their extension. In any case, both iqrSG and rmsSG are well suited to quantify the spread of SG stars in Δcol (correlation 4 in Table 3).
Correlations of extensions and other parameters.
For geometric reasons, we chose the major axis of the ellipse as our preferred observable for the extension of the RG1 region, since it reproduces the length of the FG distribution exactly in the direction in which it is more elongated. We note that L22 and M17 only used the displacement in Δcol along the horizontal axis, without considering the inclination of RG1. In other words, their measurements are a scaled version of our measured extensions according to Pythagoras’ theorem. We use lenRG1 to investigate the dependence of the RG1 region on global GC parameters. On the other hand, to quantitatively compare the properties of FG and SG stars we are necessarily forced to employ the other quantities, iqr and rms values.
In most cases, the values of iqrFG and iqrSG (as well as of rmsFG and rmsSG) are not dramatically different. This result is unexpected, since it is generally claimed that the extension in Δcol is larger for FG than for SG stars (see e.g. L22 and M17). We note that the derivation of a metallicity spread in M17 and L22 is focused only on the FG spread or extension in Δcol, whereas the similar spread in SG stars is almost completely neglected, despite it being significant (see next Section). The cluster NGC 2808 is the most extreme case, since its lenRG1 is smaller than the extent of RG2. Excluding NGC 2808, the average values become more comparable, as is shown by the iqr values in Table 2.
The relation of the measured extent of RG1 with respect to other relevant quantities is shown in Fig. 8. Statistical values for the correlations (or the lack of any relation) regarding mutual parameters of the MPs in GCs are reported in the middle part of Table 3. Possible interesting correlations with global GC parameters have their statistical values listed in the third part of Table 3.
The first consideration from Fig. 8 (leftmost panel) is that there is no correlation between the extent of the RG1 sequence of FG stars and the values of the metallicity spread computed by L22 (see correlation 12 in Table 3). This striking evidence is clearly visualised in Fig. 9. In the four panels of this figure, we grouped GCs according to the [Fe/H] spread of FG stars derived by L22, and for each group we plotted the ellipses enclosing the RG1 sequences. As a matter of fact, metallicity spreads and extensions of FG stars in the PCM are unrelated. Putatively, almost identical FG[Fe/H] spreads correspond to wildly different extensions of RG1.
Similarly, there is no correlation between lenRG1 and the fraction of FG stars in each GC estimated by M17 on the PCM (second panel in Fig. 8 and correlation 5 in Table 3). Thus, how far the RG1 extends does not seem to be dependent on the number of FG stars in the GC, and apparently requires the involvement of some other parameters.
A robust correlation does actually exist between the extension, lenRG1, and the width, W1g, of the FG stars on the RGB in col = mF275W − mF814W from M17 (third panel in Fig. 8). This width is the same one that is used by L22 as a starting point to translate the width of the FG region into a metallicity spread. Hence, the results of correlations (6) and (12) together suggest once more that the widths, W1g, of the FG stars used by L22 are sound, being wider when lenRG1 is larger, but that they are somehow converted into unrealistic metallicity spreads that, moreover, do not seem to have any correspondence with the measured extension of RG1 in the PCM. This would suggest that the conversion of W1g into [Fe/H] values is the source of the error.
Moreover, there is a positive and statistically significant correlation between the lenRG1 and the GC global metallicity (fourth panel of Fig. 8) on the metallicity scale by Carretta et al. (2009a). However, this correlation goes in the opposite direction with respect to the one given by L22. In L22, larger metallicity spreads are found for metal-poor GCs (see their Figure 12 or their Table 4), whereas in Fig. 8 lenRG1 is larger in more metal-rich GCs.
Finally, lenRG1 does not correlate with either the GC intrinsic metallicity spreads (correlations 14 and 15 in Table 3) or the age and mass (present-day or initial) of the GCs (correlations 16, 17, and 18). The relation of lenRG1 with the extension of the Na–O anti-correlation, the main spectroscopic signature of MPs (correlation 19), is also not significant.
A perhaps unexpected result when quantifying the extension of the sequences in the PCM is shown in Fig. 10. We found that the extension of RG1 is tightly correlated with the extent of the RG2 in Δcol. In this figure, we also report the Pearson’s correlation coefficient. The tight relation between iqrFG and iqrSG is true regardless of whether NGC 2808 is included (p = 3.5 × 10⁻⁴) or not (p = 5.9 × 10⁻⁵) in the sample. This result prompted us to take a closer look at the extension of the RG2 sequence and its relation to the global cluster parameters, filling the void left in the M17 and L22 analyses, which focus only on the Δcol spread of the FG stars.
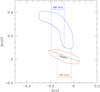 |
Fig. 6 Schematic plot of a PCM, with RG1 and RG2 indicated in red and blue, respectively. The lines and segments show the different measures of their extension in Δcol, and along the elongated region of FG stars enclosed by the ellipse (see text for a description). |
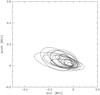 |
Fig. 7 Ellipses representing the RG1 region in all GCs considered here. The major axis length, the axis ratio, and the inclination were derived in the manner described in the text. |
 |
Fig. 8 Extension of the region RG1 plotted with respect to other quantities. Leftmost panel: metallicity spread of FG stars by L22. Second panel: fraction of FG stars in each GC from M17. Third panel: width of the FG stars on the RGB in the mF814W – col CMD from M17. Fourth panel: metallicity of GCs on the metallicity scale by Carretta et al. (2009a). |
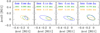 |
Fig. 9 Relation (or lack thereof) between the extension in RG1 (here described by the major axis of the ellipses) and the spread in metallicity proposed by L22. For clarity, we show four panels with only three cases with similar spreads, as is claimed by L22, in each one. The GCs and the metallicity spreads are indicated in the plots with the same colour as the corresponding ellipse. The extensions lenRG1 are in Table 2. |
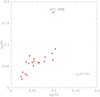 |
Fig. 10 Extension of the RG2 region as a function of the extension of the sequence of FG stars, RG1. The Pearson’s correlation coefficient is reported. |
 |
Fig. 11 Comparison between the distributions of RG1 (in red) and RG2 (in blue) in Δcol in 20 GCs from CB24. In each panel, the two Gaussians with σ equal to the rms are shown. The peaks have both been shifted to zero to get an immediate comparison. The horizontal lines in each panel indicate the iqrFG and iqrSG (red and blue, respectively). |
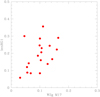 |
Fig. 12 Extension of the RG1 region as a function of the width of the SG stars (from M17) along the RGB in 20 GCs. |
5 The elephant in the room: spreads in the neglected SG stars in GCs
The basic observation upon which a claim of a metallicity spread is based is the large extension of the RG1 with respect to the observational errors, estimated with Monte Carlo simulations. The main effects of abundances on the shapes of PCMs are clearly summarised in Marino et al. (2019: their Figure 27). An enhancement of about 1.2 dex in [N/Fe] explains the vertical extension of SG stars in the region RG2 on the PCM along the Δcol3 coordinate. A spread of iron affects the position of FG stars along RG1.
This simplified scheme, however, does not account for other features of the PCM. The RG1 is not horizontal but tilted in the PCM, meaning that in principle it must also have a vertical component along Δcol3, the coordinate that is mainly affected by changes in the N content. The N content is the basic feature of the photometric classification of stars into MPs in GCs.
On the other hand, besides a strong component in Δcol3, RG2 also shows a noticeable component along Δcol. Hence, if the claim by M17 and L22 of a link between the spread in Δcol and iron is sound, there is no reason not to also contemplate a metallicity spread among SG stars.
The comparison shown in Fig. 10 clearly indicates that as the length of the FG sequence in Δcol increases, so does the extension of the RG2 region populated by SG stars. The correlation has a high statistical significance; hence, if the displacement along Δcol has to be associated with a metallicity spread, the logical inference would be to infer a spread in [Fe/H] also in SG stars. From Fig. 10, the comparison between the respective extensions of RG1 and RG2 is highly significant. The spread of RG2 along the Δcol coordinate (supposedly related to the metallicity spread) is not only very comparable to the measured lenRG1 values, but in the case of NGC 2808 it is clearly much larger than lenRG1 itself.
A more thorough comparison can be seen in Fig. 11. In this figure, we show the distributions of RG1 and RG2 in Δcol for the 20 GCs from CB24. In each panel, we show the Gaussian with σ equal to the rms; the Gaussian peaks have been shifted to zero using the mean values, to get an immediate comparison between the RG1 and RG2 distributions (in red and blue, respectively). To complete the comparison, we also plot lines indicating the iqr values for FG and SG stars, using the same colours.
To introduce further complexity, in Fig. 12 the extension of the FG sequence is found to correlate to the width of the SG stars on the CMD, with high statistical significance (see correlation 7 in Table 3). At face value, this means that, were the extension of RG1 to really be related only to the metallicity spread, the same would also be required to explain the spread of the SG stars on the CMD. Clearly, the scenario depicted by L22 by neglecting the polluted stars in their speculations is too simplistic.
The extensions of the RG2 region along the Δ col coordinate in the PCM is correlated to the width W2g of SG stars on the RGB, and also to the width W1g of FG stars (left and middle panels in Fig. 13). A statistically significant dependence on the GC metallicity is detected for iqrSG (right panel in Fig. 13).
The extension of RG2 in Δcol is plotted as a function of a few other global parameters of GCs in Fig. 14. The correlation with the cluster age is formally not significant (p = 0.055), but this result is borderline, since had we instead used the quantity rmsSG, the correlation would have become significant (p = 0.049), although barely. No clear dependence on the present-day mass of GCs is detected, whereas we found that the extension of RG2 seems to depend on the initial mass of GCs (second panel in Fig. 14 and correlations 21 and 22 in Table 3). Further studies on the spread in (pseudo-)colours and chemical abundances as their cause are clearly called for, also to assist with the interpretation of the properties of SG stars.
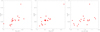 |
Fig. 13 Extension of the RG2 region of SG stars as a function of the width of FG stars on the RGB (left panel), the width of SG stars (middle panel), and metallicity [Fe/H] (right panel) in 20 GCs. |
 |
Fig. 14 Extension of the RG2 region of SG stars in 20 GCs as a function of the GC ages (leftmost panel), total absolute magnitude (second panel), initial GC mass (third panel), and interquartile range of the [O/Na] ratio (fourth panel). References for data sources are listed in Table 3. |
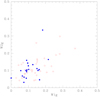 |
Fig. 15 Correlation of the width W1g of FG stars in col and the width W2g of SG stars for the 56 GCs in M17. The GCs in the subsample by CB24 utilised in the present paper are plotted as filled blue symbols. |
6 Summary
In the present paper, we have addressed the issue of the metallicity spreads that have been claimed for FG stars in GCs. We have investigated the large metallicity spreads in FG GC stars found by L22, which are surprising in stellar systems that formed without extended star formation. The explanation provided by L22 is based on inhomogeneous mixing during the primary star formation. Afterward, when mixing of polluter matter and pristine gas was used to form the subsequent population of SG, low-mass stars, a more thorough homogenisation is predicted to occur, effectively removing any detectable difference in [Fe/H].
We used a large sample of FG stars with spectroscopic abundances and the only available published set of PCMs to match the Δcol position of stars along the RG1 sequences. Selecting stars with very similar atmospheric parameters, we found no clear correlation between differences in [Fe/H] and displacement in Δcol. Over 30 pairs of stars in 12 GCs, the average shift in Δcol (0.090 mag, rms = 0.114 mag), which is not statistically significant, is not proportional to the differences in the metallicities of the stars in each pair.
For the first time, we quantified the real extension of the RG1 sequence of FG stars on the PCM. We measured the interquartile range of the extension in Δcol (to alleviate the impact of outliers), the spread in Δcol, rmsFG, and the major axis of the ellipse enclosing the FG sequence, lenRG1. All these parameters are perfectly consistent with each other. Using these quantitative measurements:
We did not find any relation between the metallicity spread among FG stars derived by L22 and the true extension of the region populated by FG stars in the PCM. Globular clusters with very different RG1 extensions have identical spreads in [Fe/H] according to L22 (see Fig. 9);
There is also no significant correspondence between the lenRG1 values and any estimate of the intrinsic metallicity spread of the GCs as a whole available in the literature. Instead, we found that the actual extent of the RG1 region in Δcol increases as the average metallicity [Fe/H] of the GCs increases (Fig. 8);
The true extension of the RG1 sequence, lenRG1, correlates to the width W1g of the FG stars on the RGB in the mF814W versus col plane (Fig. 8), but it also correlates to the width W2g of the SG stars (Fig. 12). Both these relations have high statistical significance;
lenRG1 correlates very well to the analogous extension in Δcol of the SG sequence. This result should not be unexpected, since the spread of FG stars in col on the RGB is complementary to the spread of SG stars. The more extended the location of SG stars is, the less the one of FG stars is, and vice versa. When the distance from the fiducial red and blue envelopes of the RGB are used to produce the PCM, the procedure likely provides the statistical significant correlation observed of lenRG1 to the extent in Δcol of the RG2. This occurrence, neglected by M17, is clearly shown in Fig. 15, in which we plot the correlation of the widths W1g and W2g from M17. In the figure, GCs analysed in the present paper are depicted as filled symbols, and the correlation is highly significant (correlation 8 in Table 3). However, considering the whole sample of 56 GCs tabulated in M17, the correlation of W1g with W2g is even more significant (Pearson’s correlation coefficient r = 0.652, p < 1.0 × 10⁻⁶), a fact not mentioned in either M17 or L22;
The extension in Δcol of the RG2 presents significant relations with the cluster average metallicity [Fe/H] and the total GC mass (either the present-day mass or the initial mass before any dynamical evolution onset). The correlation between the extension of RG2 and the GC age is more uncertain and is barely statistically significant.
Finally, since the extension of RG1 and RG2 increases as the width of FG and SG stars increases on the RGB, this probably means that W1g and W2g are reasonable estimates. It is likely that the conversion of these widths into the spread of [Fe/H] is the problem.
Acknowledgements
We thank the referee for careful and useful comments and suggestions. This research has made use of the VizieR catalogue access tool, CDS, Strasbourg, France (DOI: 10.26093/cds/vizier). The original description of the VizieR service was published in 2000, A&AS 143, 23. Use of the NASA’s Astrophysical Data System, and TOPCAT (Taylor 2005) are also acknowledged.
Appendix A Pairs of FG stars with similar atmospheric parameters
In this Appendix we list the pairs of FG stars with similar atmospheric parameters in Table A.1. Their position is superimposed to the PCMs in Fig. A.1 and Fig. A.2.
 |
Fig. A.1 Position of pairs of FG stars with similar atmospheric parameters (large red filled symbols) in NGC 288, NGC 2808, NGC 3201, NGC 4590, NGC 4833, NGC 6093, and NGC 6254 |
 |
Fig. A.2 Position of pairs of FG stars with similar atmospheric parameters (red circles) in NGC 6254, NGC 6397, NGC 6535, NGC 6838, and NGC 6121. |
Pairs of FG stars with similar atmospheric parameters
Appendix B Selected samples of FG and SG stars in the program GCs
We present here the selection of FG and SG stars (i.e., the populations of the RG1 and RG2 regions, respectively) for the 20 GCs discussed in the present paper. We used the PCMs derived by CB24 and isolated RG1 and RG2 stars manually, using TOPCAT; the result of the selection is shown in the following figures (from Fig. B.1 to Fig. B.5), where FG stars are coloured in red and SG stars are coloured in blue, respectively. Stars falling far from the main distributions in the CMDs, and consequently in the PCMs, were ignored; they are always a minority and are indicated in grey in the plots. In each plot we also show the ellipse enclosing the RG1 (in black) with the major axis measuring the actual extension of RG1 drawn in green. Information on the extension of the RG1 and its inclination is given in Table 4 in the main text.
 |
Fig. B.1 Separation of FG and SG stars (in red and blue, respectively) in the PCMs of the four clusters NGC 0104, NGC 0288, NGC 0362, and NGC 1851. The ellipses indicate the RG1 region. |
 |
Fig. B.2 The same, for NGC 2808 (notice the slightly different x-axis scale), NCGC 3201, NGC 4590, and NGC 4833. |
 |
Fig. B.3 The same, for NGC 5904, NCGC 6093, NGC 6121, and NGC 6205. |
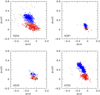 |
Fig. B.4 The same, for NGC 6254, NCGC 6397, NGC 6535, and NGC 6752. |
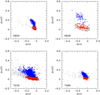 |
Fig. B.5 The same, for NGC 6809, NCGC 6838, NGC 7078, and NGC 7099. |
References
- Bailin, J. 2019, ApJS, 245, 5 [NASA ADS] [CrossRef] [Google Scholar]
- Bailin, J., & von Klar, R. 2022, ApJ, 925, 36 [NASA ADS] [CrossRef] [Google Scholar]
- Bastian, N., & Lardo, C. 2018, ARA&A, 56, 83 [Google Scholar]
- Battaglia, G., Tolstoy, E., Helmi, A. et al. 2006, A&A, 459, 423 [NASA ADS] [CrossRef] [EDP Sciences] [Google Scholar]
- Baumgardt, H., Hilker, M., Sollima, A., & Bellini, A. 2019, MNRAS, 482, 5138 [Google Scholar]
- Bekki, K., & Freeman, K. C. 2003, MNRAS, 346, L11 [Google Scholar]
- Boberg, O. M., Friel, E. D., & Vesperini, E. 2016, ApJ, 824, 5 [NASA ADS] [CrossRef] [Google Scholar]
- Bragaglia, A., Carretta, E., D’Orazi, V. et al. 2017, A&A, 607, A44 [NASA ADS] [CrossRef] [EDP Sciences] [Google Scholar]
- Calamida, A., Bono, G., Stetson, P. B. et al. 2007, ApJ, 670, 400 [Google Scholar]
- Carretta, E. 2015, ApJ, 810, 148 [Google Scholar]
- Carretta, E., & Bragaglia, A. 2024, A&A, 690, A158 [NASA ADS] [CrossRef] [EDP Sciences] [Google Scholar]
- Carretta, E., Gratton, R.G., Clementini, G., & Fusi, P. F. 2000, ApJ, 533, 215 [NASA ADS] [CrossRef] [Google Scholar]
- Carretta, E., Bragaglia, A., Gratton, R.G., et al. 2006, A&A, 450, 523 [NASA ADS] [CrossRef] [EDP Sciences] [Google Scholar]
- Carretta, E., Bragaglia, A., Gratton, R. G., D’Orazi, V., Lucatello, S. 2009a, A&A, 508, 695 [NASA ADS] [CrossRef] [EDP Sciences] [Google Scholar]
- Carretta, E., Bragaglia, A., Gratton, R. G. et al. 2009b, A&A, 505, 117 [NASA ADS] [CrossRef] [EDP Sciences] [Google Scholar]
- Carretta, E., Bragaglia, A., Gratton, R.G., Lucatello, S. 2009c, A&A, 505, 139 [NASA ADS] [CrossRef] [EDP Sciences] [Google Scholar]
- Carretta, E., Bragaglia, A., Gratton, R. G. et al. 2010a, ApJ, 714, L7 [Google Scholar]
- Carretta, E., Bragaglia, A., Gratton, R.G. et al 2010b, A&A, 516, A55 [NASA ADS] [CrossRef] [EDP Sciences] [Google Scholar]
- Carretta, E., Bragaglia, A., Gratton, R. G., D’Orazi, V., & Lucatello, S. 2011a, A&A, 535, 121 [Google Scholar]
- Carretta, E., Lucatello, S., Gratton, R. G., Bragaglia, A., D’Orazi, V. 2011b, A&A, 533, 69 [Google Scholar]
- Carretta, E., Bragaglia, A., Gratton, R. G. et al. 2014, A&A, 564, A60 [NASA ADS] [CrossRef] [EDP Sciences] [Google Scholar]
- Carretta, E., Bragaglia, A., Gratton, R. G. et al. 2015, A&A, 578, A116 [CrossRef] [EDP Sciences] [Google Scholar]
- Cohen, J. G., & Melendez, J. 2005, AJ, 129, 303 [NASA ADS] [CrossRef] [Google Scholar]
- Dopita, M. A., & Smith, G. H. 1986, ApJ, 304, 283 [NASA ADS] [CrossRef] [Google Scholar]
- Dotter, A., Chaboyer, B., Jevremovic, D. et al. 2007, AJ, 134, 376 [NASA ADS] [CrossRef] [Google Scholar]
- Fanelli, C., Origlia, L., Rich, R. M. et al. 2024, A&A, 690, A139 [NASA ADS] [CrossRef] [EDP Sciences] [Google Scholar]
- Gaia Collaboration (Brown, A. G. A., et al.) 2018a, A&A, 616, A1 [NASA ADS] [CrossRef] [EDP Sciences] [Google Scholar]
- Gaia Collaboration (Helmi, A., et al.) 2018b, A&A, 616, A12 [NASA ADS] [CrossRef] [EDP Sciences] [Google Scholar]
- Gaia Collaboration (Vallenari, A., et al.) 2023, A&A, 674, A1 [NASA ADS] [CrossRef] [EDP Sciences] [Google Scholar]
- Gratton, R. G., Bonifacio, P., Bragaglia, A., et al. 2001, A&A, 369, 87 [NASA ADS] [CrossRef] [EDP Sciences] [Google Scholar]
- Gratton, R. G., Sneden, C., & Carretta, E. 2004, ARA&A, 42, 385 [Google Scholar]
- Gratton, R. G., Carretta, E., & Bragaglia, A. 2012, A&ARv, 20, 50 [CrossRef] [Google Scholar]
- Gratton, R. G., Bragaglia, A., Carretta, E., D’Orazi, V., Lucatello, S., & Sollima, A. 2019, A&ARv, 27, 8 [NASA ADS] [CrossRef] [Google Scholar]
- Harris, W. E. 2010, arXiv e-prints [arXiv:1012.3224] [Google Scholar]
- Johnson, C. I., Rich, M. R., Pilachowski, C. A. et al. 2015, AJ, 150, 63 [NASA ADS] [CrossRef] [Google Scholar]
- Johnson, C. I., Calamida, A., Kader, J. A. et al. 2023, AJ, 163, 3 [NASA ADS] [CrossRef] [Google Scholar]
- Kirby, E. N., Guhathakurta, P., Simon, J. D. et al. 2010, ApJS, 191, 352 [NASA ADS] [CrossRef] [Google Scholar]
- Kirby, E. N., Lanfranchi, G. A., Simon, J. D., Cohen, J. G., Guhathakurta, P. 2011, ApJ, 727, 78 [NASA ADS] [CrossRef] [Google Scholar]
- Kruijssen, J. M. D., Pfeffer, J. L., Reina-Campos, M., Crain, R. A. Bastian, N. 2019, MNRAS, 486, 3180 [NASA ADS] [CrossRef] [Google Scholar]
- Langer, G. E., Hoffman, R., & Sneden, C. 1993, PASP, 105, 301 [NASA ADS] [CrossRef] [Google Scholar]
- Lardo, C., Bellazzini, M., Pancino, E. et al. 2011, A&A, 525, A114 [NASA ADS] [CrossRef] [EDP Sciences] [Google Scholar]
- Lardo, C., Salaris, M., Cassisi, et al. 2023, A&A, 669, A19 [NASA ADS] [CrossRef] [EDP Sciences] [Google Scholar]
- Lee, J.-W., Lee, J., Kang, Y.-W. et al. 2009, ApJ, 695, L78 [NASA ADS] [CrossRef] [Google Scholar]
- Legnardi, M. V., Milone, A. P., Armillotta, L. et al. 2022, MNRAS, 513, 735 [NASA ADS] [CrossRef] [Google Scholar]
- Legnardi, M. V., Milone, A. P., Cordoni, G. et al. 2024, A&A, 687, A160 [NASA ADS] [CrossRef] [EDP Sciences] [Google Scholar]
- Leitinger, E., Baumgardt, H., Cabrera-Ziri, I., Hilker, M., & Pancino, E. 2023, MNRAS, 520, 1456 [NASA ADS] [CrossRef] [Google Scholar]
- Marino, A. F., Villanova, S., Piotto, G. et al. 2008, A&A, 490, 625 [NASA ADS] [CrossRef] [EDP Sciences] [Google Scholar]
- Marino, A. F., Milone, A. P., Sills, A. et al. 2019, ApJ, 887, 91 [NASA ADS] [CrossRef] [Google Scholar]
- Milone, A. P., Piotto, G., Renzini, A. et al. 2017, MNRAS, 464, 3636 [Google Scholar]
- Nardiello, D., Libralato, M., Piotto, G. et al. 2018, MNRAS, 481, 3382 [NASA ADS] [CrossRef] [Google Scholar]
- Salaris, M., Cassisi, S., & Weis, A. 2002, PASP, 114, 375 [NASA ADS] [CrossRef] [Google Scholar]
- Sbordone, L., Salaris, M., Weiss, A., & Cassisi, S. 2011, A&A, 534, A9 [CrossRef] [EDP Sciences] [Google Scholar]
- Siegel, M. H., Dotter, A., Majewski, S. R. et al. 2007, ApJ, 667, L57 [NASA ADS] [CrossRef] [Google Scholar]
- Sneden, C., Kraft, R. P., Guhathakurta, P., Peterson, R. C., & Fulbright, J. P. 2004, AJ, 127, 2162 [NASA ADS] [CrossRef] [Google Scholar]
- Stetson, P. B., Pancino, E., Zocchi, A., Sanna, N., & Monelli, M. 2019, MNRAS, 485, 3042 [Google Scholar]
- Taylor, M. B. 2005, Astronomical Data Analysis Software and Systems XIV, 347, 29 [NASA ADS] [Google Scholar]
- VandenBerg, D. A., Brogaard, K., Leaman, R., & Casagrande, L. 2013, ApJ, 775, 134 [Google Scholar]
- Willman, B., & Strader, J. 2012, AJ, 144, 76 [Google Scholar]
Note that L22 provide for ω Cen a mere spread of 0.148 dex. This GC is then dropped from the sample in Legnardi et al. (2024), together with a few others GCs, due to its complexity.
When properly focused deep photometry is used, the large error bars found here for the lower-RGB region in the dwarf galaxies decrease to values comparable to those of GCs.
All Tables
All Figures
|
Fig. 1 Metallicity spreads for FG stars derived from PCMs by L22 as a function of the intrinsic dispersion in [Fe/H] calculated in Bailin & von Klar (2022) for 33 GCs that the two studies have in common. |
| In the text | |
|
Fig. 2 Spread in [Fe/H] for FG stars in 55 GCs (open black squares) as a function of the GC present-day mass expressed by the total absolute magnitude, MV (Harris 2010). Metallicity spreads were derived from PCMs by L22. Filled red circles and black triangles are spectroscopic [Fe/H] spreads σ[Fe/H] of GCs and dwarf galaxies, respectively, from Willman & Strader (2012). A few interesting objects are labelled in the figure. |
| In the text | |
|
Fig. 3 Comparison of the RGBs in the CMDs of GCs and dwarf galaxies. Upper panels: NGC 5024 (M 53, filled red points) is compared to the dwarf galaxies Fornax and Leo I (empty circles). Lower panels: Comparison of NGC 5024 with two massive GCs, ω Cen and M 54 (left and right panel, respectively). The inset in each panel shows the metallicity distribution of the compared samples. Typical error bars in the Gaia photometric system are indicated. |
| In the text | |
|
Fig. 4 Initial masses of GCs from Baumgardt et al. (2019) for the population of GCs in the Milky Way plotted as a function of the present-day total absolute luminosity. Solid and dashed lines indicate values of ∼3 × 10⁶ M⊙ and 9 × 10⁵ M⊙. The filled red circle represents NGC 5024 and blue circles indicate GCs presently known to have, to some extent, a metallicity dispersion. |
| In the text | |
|
Fig. 5 Summary of the variations in [Fe/H] as a function of the Δcol variation along the RG1 region on the PCM from 30 pairs of FG stars with similar atmospheric parameters. The plotted values are the absolute differences in [Fe/H] and Δcol between the two stars in each pair. Pairs formed with stars in NGC 3201 are plotted as filled blue circles. |
| In the text | |
|
Fig. 6 Schematic plot of a PCM, with RG1 and RG2 indicated in red and blue, respectively. The lines and segments show the different measures of their extension in Δcol, and along the elongated region of FG stars enclosed by the ellipse (see text for a description). |
| In the text | |
|
Fig. 7 Ellipses representing the RG1 region in all GCs considered here. The major axis length, the axis ratio, and the inclination were derived in the manner described in the text. |
| In the text | |
|
Fig. 8 Extension of the region RG1 plotted with respect to other quantities. Leftmost panel: metallicity spread of FG stars by L22. Second panel: fraction of FG stars in each GC from M17. Third panel: width of the FG stars on the RGB in the mF814W – col CMD from M17. Fourth panel: metallicity of GCs on the metallicity scale by Carretta et al. (2009a). |
| In the text | |
|
Fig. 9 Relation (or lack thereof) between the extension in RG1 (here described by the major axis of the ellipses) and the spread in metallicity proposed by L22. For clarity, we show four panels with only three cases with similar spreads, as is claimed by L22, in each one. The GCs and the metallicity spreads are indicated in the plots with the same colour as the corresponding ellipse. The extensions lenRG1 are in Table 2. |
| In the text | |
|
Fig. 10 Extension of the RG2 region as a function of the extension of the sequence of FG stars, RG1. The Pearson’s correlation coefficient is reported. |
| In the text | |
|
Fig. 11 Comparison between the distributions of RG1 (in red) and RG2 (in blue) in Δcol in 20 GCs from CB24. In each panel, the two Gaussians with σ equal to the rms are shown. The peaks have both been shifted to zero to get an immediate comparison. The horizontal lines in each panel indicate the iqrFG and iqrSG (red and blue, respectively). |
| In the text | |
|
Fig. 12 Extension of the RG1 region as a function of the width of the SG stars (from M17) along the RGB in 20 GCs. |
| In the text | |
|
Fig. 13 Extension of the RG2 region of SG stars as a function of the width of FG stars on the RGB (left panel), the width of SG stars (middle panel), and metallicity [Fe/H] (right panel) in 20 GCs. |
| In the text | |
|
Fig. 14 Extension of the RG2 region of SG stars in 20 GCs as a function of the GC ages (leftmost panel), total absolute magnitude (second panel), initial GC mass (third panel), and interquartile range of the [O/Na] ratio (fourth panel). References for data sources are listed in Table 3. |
| In the text | |
|
Fig. 15 Correlation of the width W1g of FG stars in col and the width W2g of SG stars for the 56 GCs in M17. The GCs in the subsample by CB24 utilised in the present paper are plotted as filled blue symbols. |
| In the text | |
|
Fig. A.1 Position of pairs of FG stars with similar atmospheric parameters (large red filled symbols) in NGC 288, NGC 2808, NGC 3201, NGC 4590, NGC 4833, NGC 6093, and NGC 6254 |
| In the text | |
|
Fig. A.2 Position of pairs of FG stars with similar atmospheric parameters (red circles) in NGC 6254, NGC 6397, NGC 6535, NGC 6838, and NGC 6121. |
| In the text | |
|
Fig. B.1 Separation of FG and SG stars (in red and blue, respectively) in the PCMs of the four clusters NGC 0104, NGC 0288, NGC 0362, and NGC 1851. The ellipses indicate the RG1 region. |
| In the text | |
|
Fig. B.2 The same, for NGC 2808 (notice the slightly different x-axis scale), NCGC 3201, NGC 4590, and NGC 4833. |
| In the text | |
|
Fig. B.3 The same, for NGC 5904, NCGC 6093, NGC 6121, and NGC 6205. |
| In the text | |
|
Fig. B.4 The same, for NGC 6254, NCGC 6397, NGC 6535, and NGC 6752. |
| In the text | |
|
Fig. B.5 The same, for NGC 6809, NCGC 6838, NGC 7078, and NGC 7099. |
| In the text | |
Current usage metrics show cumulative count of Article Views (full-text article views including HTML views, PDF and ePub downloads, according to the available data) and Abstracts Views on Vision4Press platform.
Data correspond to usage on the plateform after 2015. The current usage metrics is available 48-96 hours after online publication and is updated daily on week days.
Initial download of the metrics may take a while.