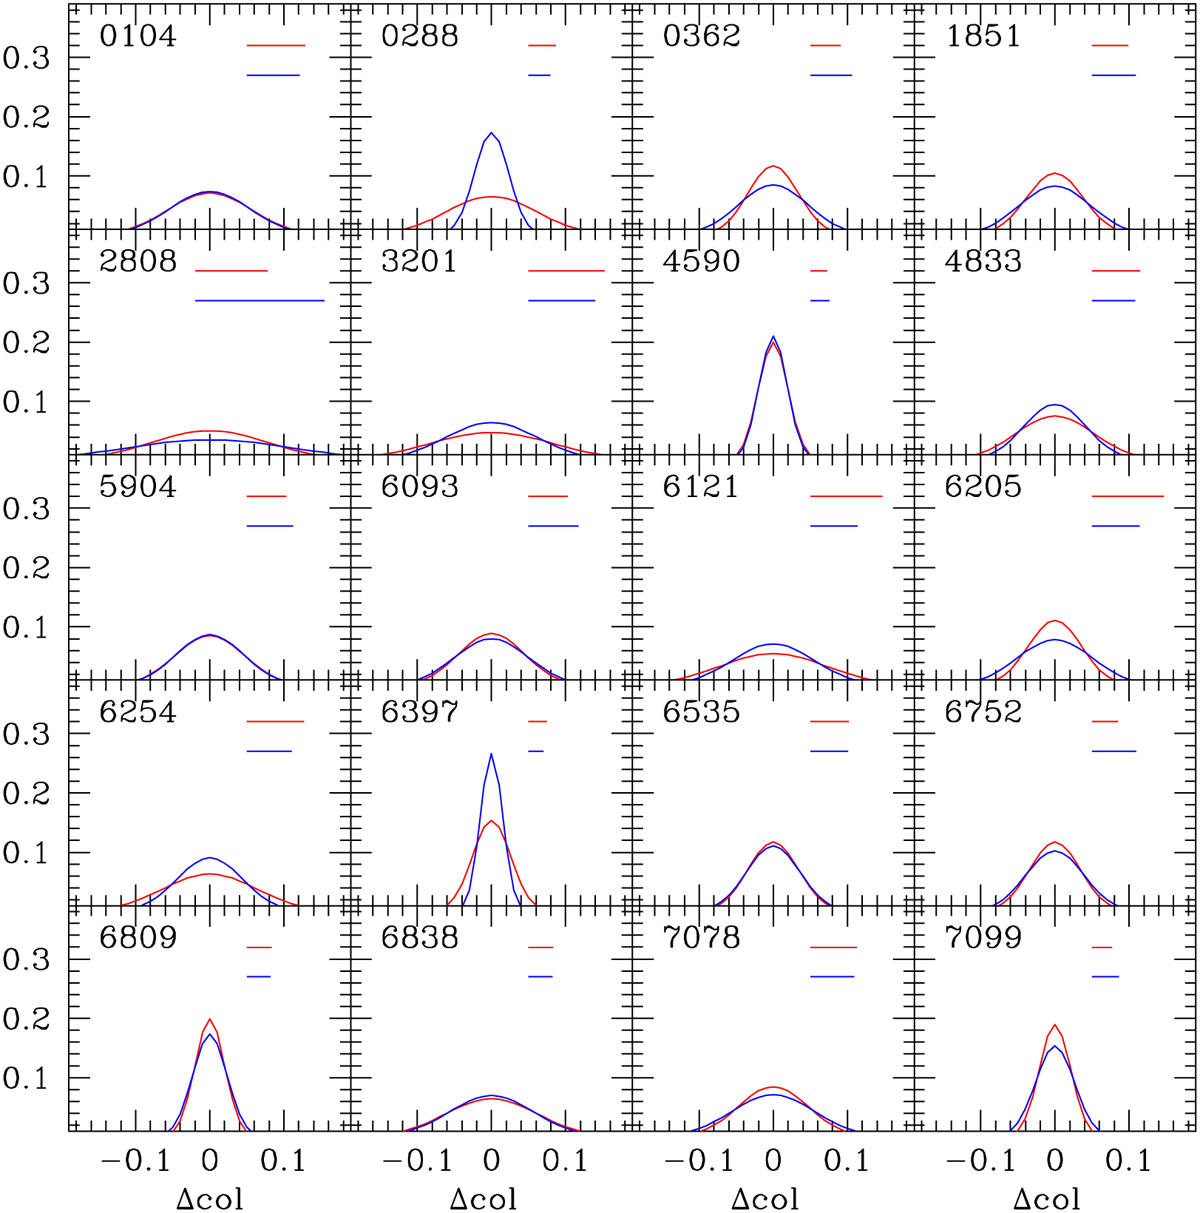
Fig. 11
Download original image
Comparison between the distributions of RG1 (in red) and RG2 (in blue) in Δcol in 20 GCs from CB24. In each panel, the two Gaussians with σ equal to the rms are shown. The peaks have both been shifted to zero to get an immediate comparison. The horizontal lines in each panel indicate the iqrFG and iqrSG (red and blue, respectively).
Current usage metrics show cumulative count of Article Views (full-text article views including HTML views, PDF and ePub downloads, according to the available data) and Abstracts Views on Vision4Press platform.
Data correspond to usage on the plateform after 2015. The current usage metrics is available 48-96 hours after online publication and is updated daily on week days.
Initial download of the metrics may take a while.