Open Access
Fig. 6
Download original image
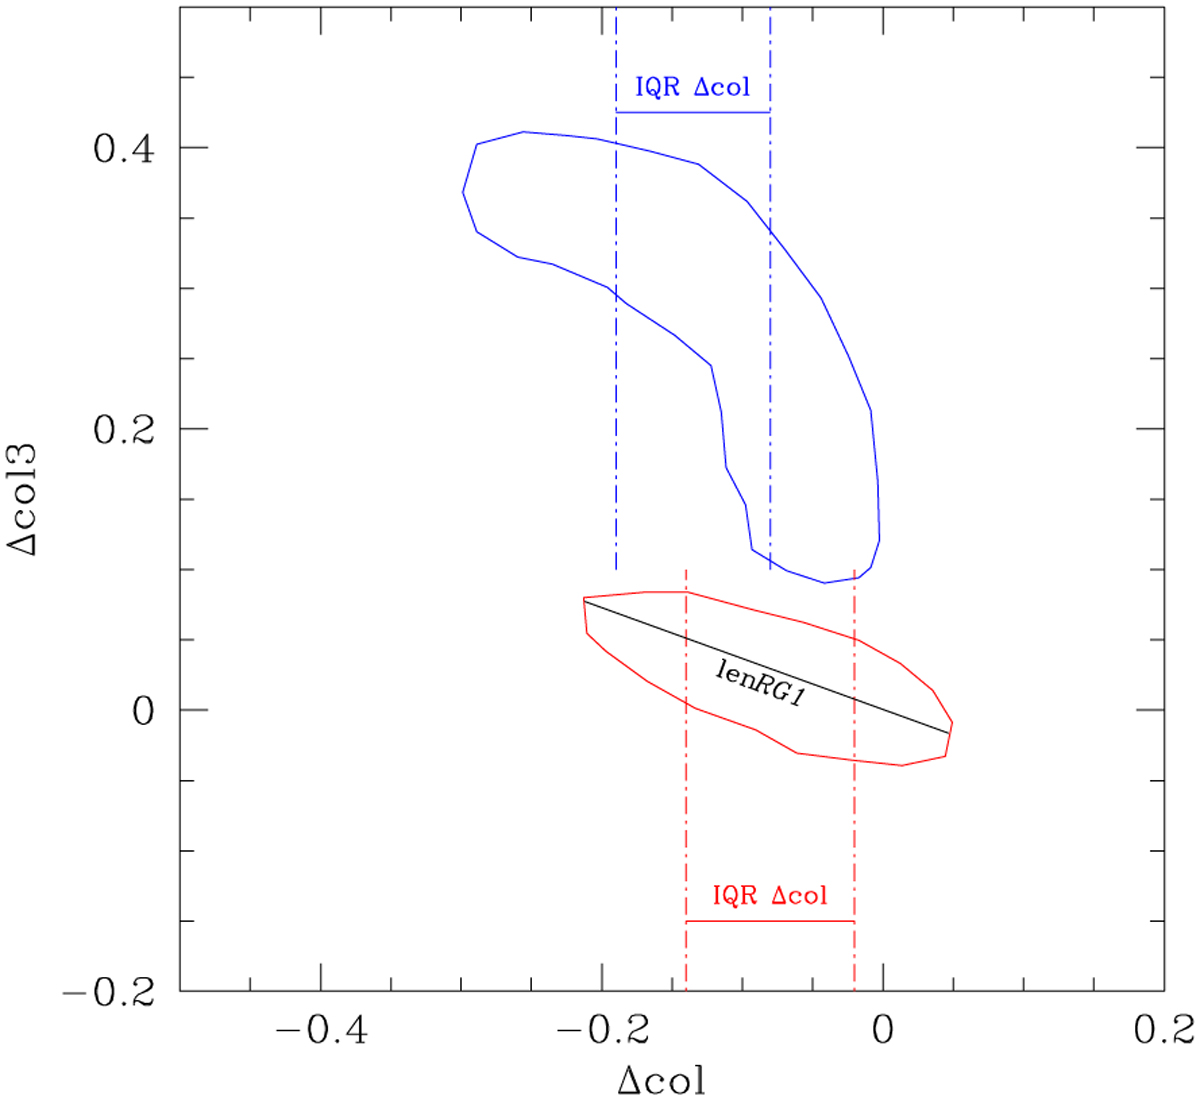
Schematic plot of a PCM, with RG1 and RG2 indicated in red and blue, respectively. The lines and segments show the different measures of their extension in Δcol, and along the elongated region of FG stars enclosed by the ellipse (see text for a description).
Current usage metrics show cumulative count of Article Views (full-text article views including HTML views, PDF and ePub downloads, according to the available data) and Abstracts Views on Vision4Press platform.
Data correspond to usage on the plateform after 2015. The current usage metrics is available 48-96 hours after online publication and is updated daily on week days.
Initial download of the metrics may take a while.