Fig. 5.
Download original image
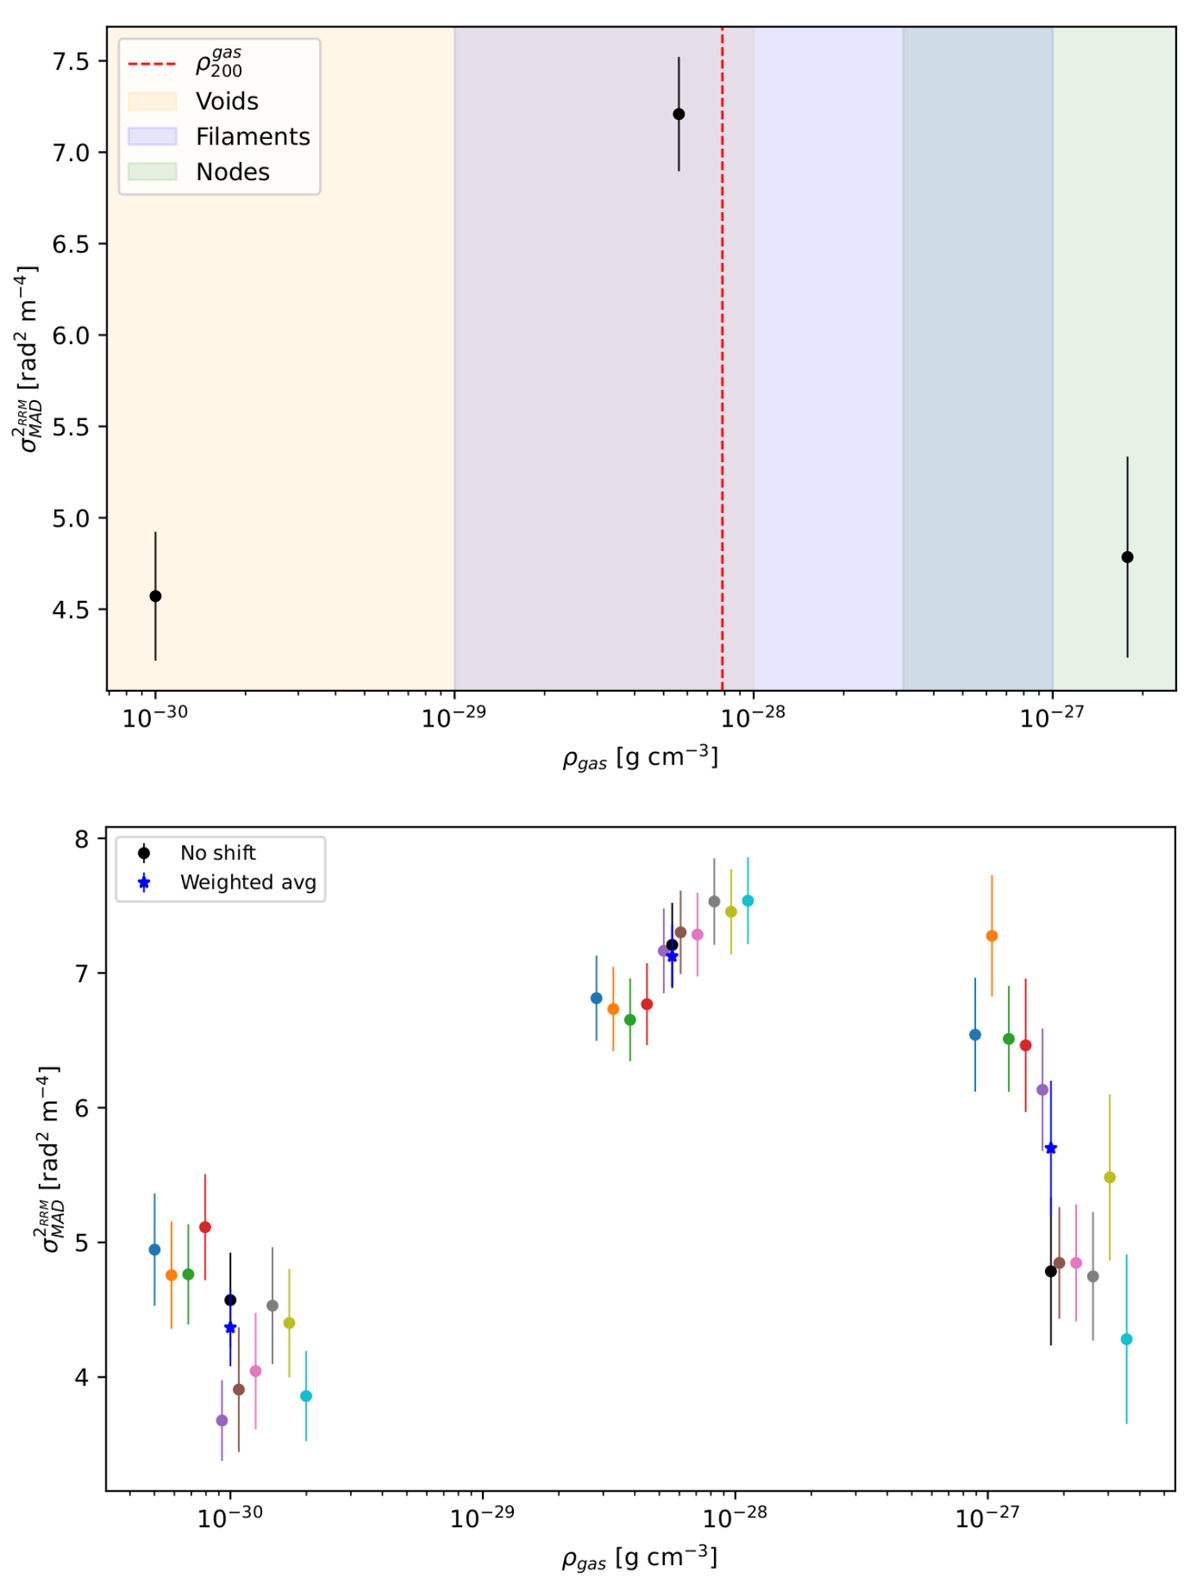
Total weighted RRM MAD variance (σMAD2RRM) trend with gas density in superclusters of galaxies. The plot shows the resulting variance from binning the sources in different gas density regimes. The background is divided into the ranges of densities that are typically related to voids (yellow), filaments (blue), and nodes (green; Cautun et al. 2014). The dashed red line represents where the gas ρ200 limit would approximately be, to highlight the density trend outside galaxy clusters. We measure an excess in the RRM variance between the first and second density bins, which can be attributed to the contribution of the low-density magnetised gas in the supercluster structure. Bottom panel: Same as the top panel, but varying the bins edges with steps of 0.03 (−0.03) with respect the original chosen value. The different resulting MAD variances and their uncertainties are show in different colours. The weighted average of these results in each bin is shown in blue and is consistent with the original value, shown in black.
Current usage metrics show cumulative count of Article Views (full-text article views including HTML views, PDF and ePub downloads, according to the available data) and Abstracts Views on Vision4Press platform.
Data correspond to usage on the plateform after 2015. The current usage metrics is available 48-96 hours after online publication and is updated daily on week days.
Initial download of the metrics may take a while.