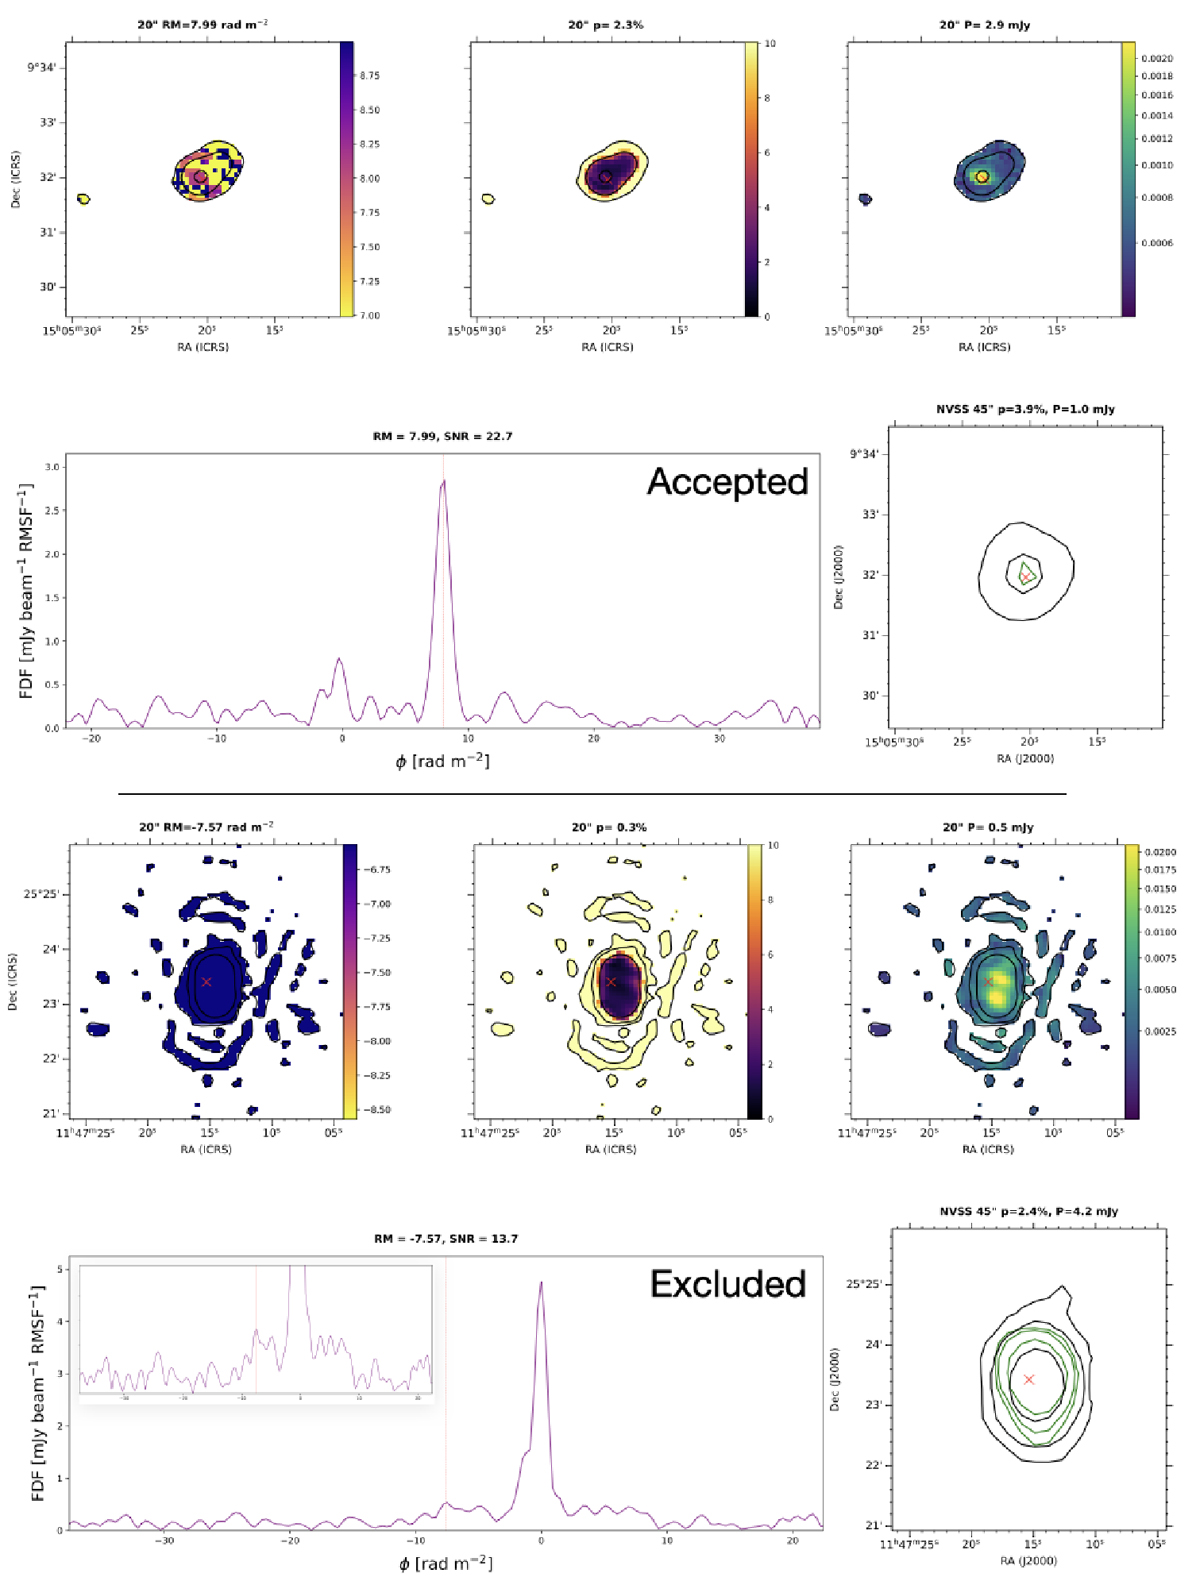
Fig. A.2.
Download original image
Inspection maps to evaluate the catalogued polarised source component. Top row: LoTSS 20″ resolution RM map, degree of polarisation map, and polarised intensity map for the catalogued source inside the Stokes I contours (black). Bottom row: FDF with the catalogued RM value and S/N for the peak, and the NVSS 45″ resolution Stokes I (black) and polarised intensity (green) contours for comparison. For the bottom source, the zoomed-in panel show the complexity of the spectrum around the selected peak. After inspection, the top source is accepted, while the bottom source is excluded.
Current usage metrics show cumulative count of Article Views (full-text article views including HTML views, PDF and ePub downloads, according to the available data) and Abstracts Views on Vision4Press platform.
Data correspond to usage on the plateform after 2015. The current usage metrics is available 48-96 hours after online publication and is updated daily on week days.
Initial download of the metrics may take a while.